.svg)
Sep-2026
Sales
Trend
6-Month
Product Count
SKUs
Avg Price
YoY Sales Change
YoY Price Change


Where to Buy
Indi Vapes (MO) is stocked at 107 licensed dispensaries across Missouri, with the deepest coverage in Kansas City, St. Louis, Springfield, Columbia, and Joplin. Search by ZIP code or city below to find the closest one, or filter by product type if you are after a specific format.
Market Insights Snapshot
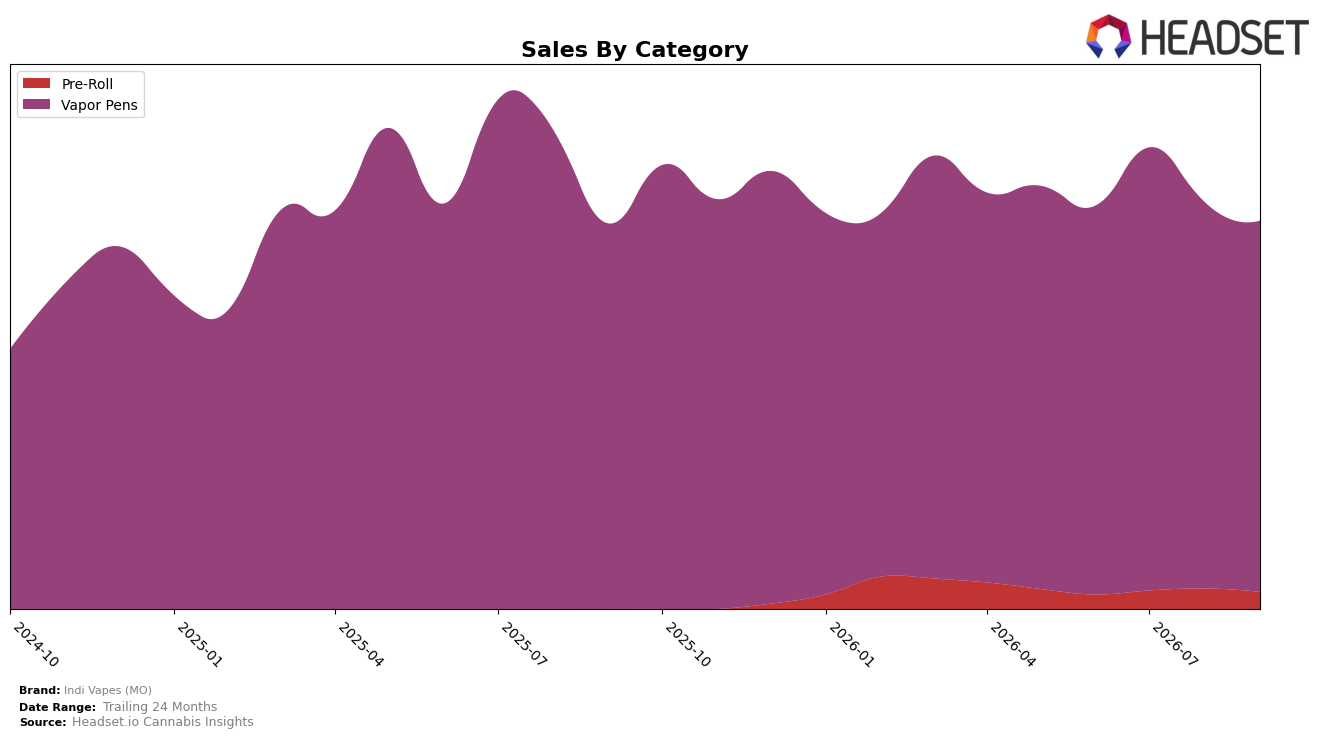
In September 2026, Indi Vapes (MO) concentrated 95.59% of sales in Vapor Pens while Pre-Roll accounted for 4.41%, with Vapor Pens down 3.72% year over year and 3.96% month over month, and Pre-Roll declining 16.49% month over month. Despite brand-level sales up 71.76% year over year and a 13.47% year-over-year drop in average price to $32.87, the Vapor Pens category mix shows contraction alongside a rank of 9 in Missouri for Vapor Pens. This combination implies the brand’s growth is coming from broader distribution or unit velocity rather than category expansion, and the tilt toward Vapor Pens concentration with a MoM pullback sets a ceiling on near-term mix-driven gains.
The shift toward a heavier Vapor Pens weighting at 95.59% coupled with a rank position of 9 in Missouri indicates reliance on a mature category where minor share losses can impact standing, while the 13.47% price decrease likely underpins the 71.76% year-over-year sales growth through volume. With Pre-Roll at just 4.41% and falling 16.49% month over month, the portfolio offers limited buffer against Vapor Pens softness, so sustaining growth likely requires either reclaiming the 3.72% year-over-year decline within Vapor Pens or growing Pre-Roll share by several points without eroding price further.
Competitive Landscape
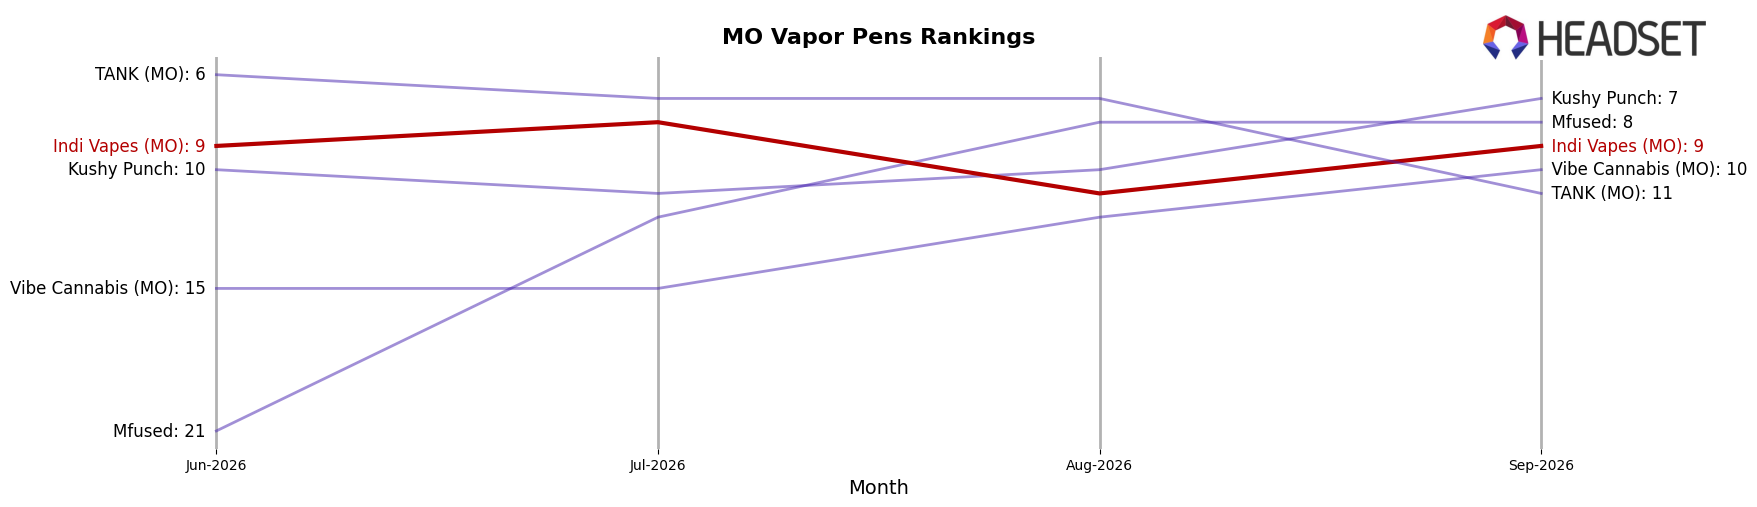
Indi Vapes (MO) sits at rank 9 in September 2026, down 1 position from rank 8 year over year, and unmoved versus June 2026 at rank 9, while the brand’s historical peak was rank 4 in July 2025—indicating a multi-quarter slide from a higher watermark. Competitively, Good Day Farm advanced from rank 5 to rank 3 alongside a 35.36% year-over-year sales gain, whereas Rove fell from rank 3 to rank 5 with a 4.34% year-over-year sales decline, creating a reshuffle directly above Indi Vapes (MO). With category leaders stable—Illicit / Illicit Gardens holding rank 1 year over year with a 17.08% sales increase and Galactic steady at rank 2 with a 20.41% rise—the persistence at rank 9 coupled with a one-rank YoY dip implies Indi Vapes (MO) is ceding relative momentum to faster-growing mid-tier rivals rather than being displaced by volatility at the very top.
Notable Products
Blue Razz Distillate Disposable (1g) posted the largest move with a 58.7% month-over-month gain, climbing into rank 5 while Pineapple Guava Distillate Disposable (1g) fell 30.3% to rank 7; this divergence implies consumer switching within the same form factor rather than category expansion. Orangesicle Distillate Disposable (1g) rose 20.1% to hold rank 1 as Strawberry Fields Distillate Disposable (1g) slid 5.6% at rank 2, pointing to flavor-led rotation at the top. Nine of the top ten are Vapor Pens while the sole Pre-Roll entry, Mellow Melon Infused Pre-Roll (1g), sits at rank 10 with $18,684 in September 2026 sales and Polar Berry Distillate Disposable (1g) declined 19.3% at rank 9, indicating concentration risk if pen flavor fatigue accelerates. The pattern suggests Indi Vapes (MO) is doubling down on disposable Vapor Pens with selective flavor bets driving share of shelf, while non-pen formats remain secondary and opportunistic.
Top Selling Cannabis Brands






Data for this report comes from real-time sales reporting by participating cannabis retailers via their point-of-sale systems, which are linked up with Headset’s business intelligence software. Headset’s data is very reliable, as it comes digitally direct from our partner retailers. However, the potential does exist for misreporting in the instance of duplicates, incorrectly classified products, inaccurate entry of products into point-of-sale systems, or even simple human error at the point of purchase. Thus, there is a slight margin of error to consider. Brands listed on this page are ranked in the top twenty within the market and product category by total retail sales volume.

