.svg)
Sep-2026
Sales
Trend
6-Month
Product Count
SKUs
Avg Price
YoY Sales Change
YoY Price Change


Where to Buy
Infinity (MO) is stocked at 10 licensed dispensaries across Missouri, with the deepest coverage in St. Louis, Belton, Cassville, Dexter, and Kansas City. Search by ZIP code or city below to find the closest one.
Market Insights Snapshot
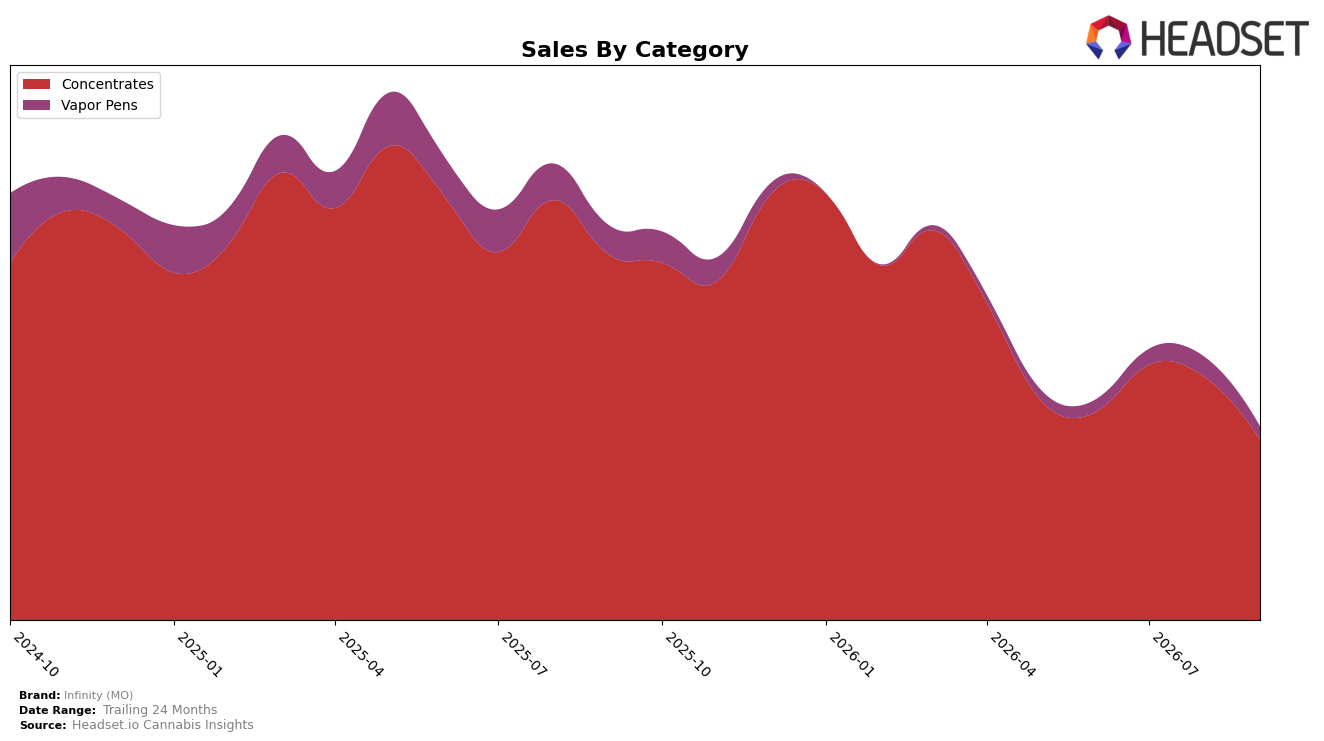
In September 2026, Infinity (MO) concentrated 91.56% of its sales in Concentrates while Vapor Pens accounted for 8.44%, with Concentrates declining 50.04% year over year and 25.22% month over month, and Vapor Pens down 49.09% year over year and 29.28% month over month. Average price fell 3.43% year over year to $29.58, while Concentrates priced at $29.90 versus Vapor Pens at $26.50, implying mix remains anchored to higher-priced units even as total brand sales contracted 49.96% year over year; the pattern suggests volume compression is broad-based but more acute month over month in Vapor Pens, reinforcing a product-line reliance that amplifies downside during category pullbacks.
With Concentrates ranking 12th in Missouri for the category, the 91.56% mix coupled with a 25.22% month-over-month drop indicates vulnerability to category-specific shocks, while the 8.44% share in Vapor Pens and its steeper 29.28% month-over-month slide limit diversification benefits. The combination of a modest 3.43% price decline and a 49.96% brand sales decline indicates that demand, not pricing, is the primary headwind, implying Infinity (MO)’s positioning is over-levered to Concentrates and would benefit from rebalancing mix toward steadier segments to reduce rank volatility around the 12 position.
Competitive Landscape
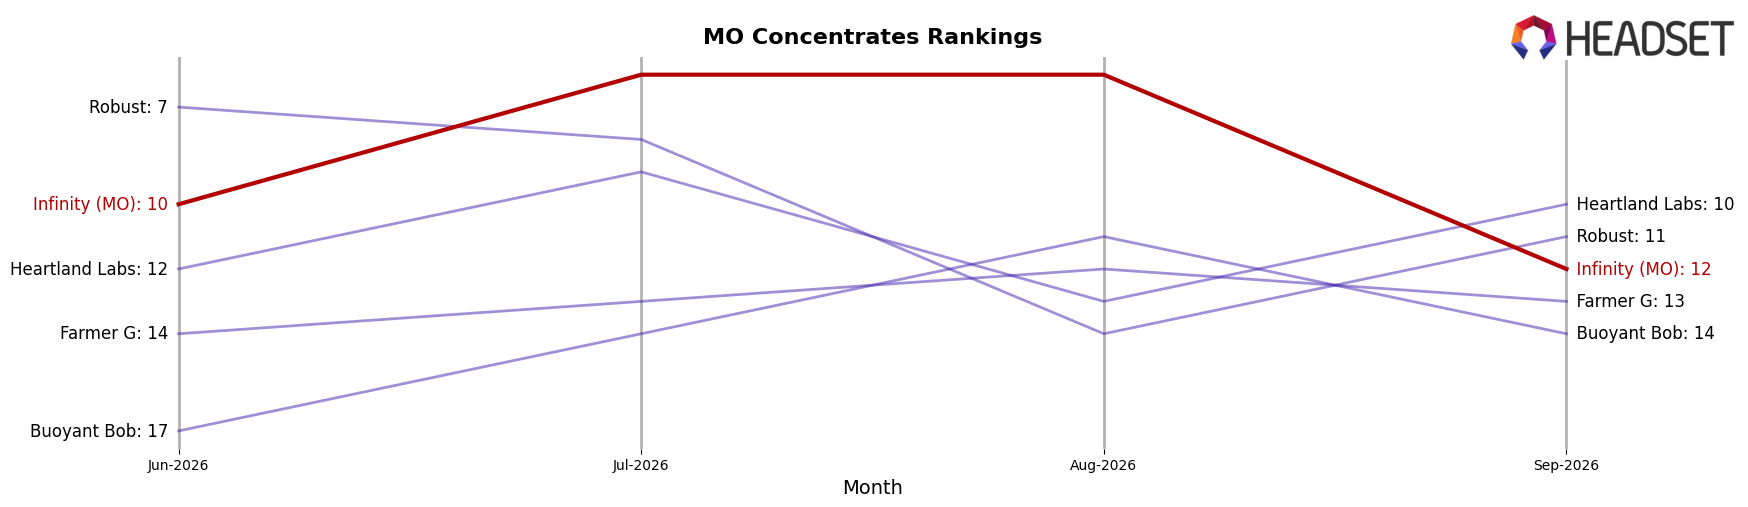
Infinity (MO) sits at rank #12 in MO Concentrates in September 2026, down 8 positions year over year from #4, and 2 positions lower than June 2026’s #10, despite having peaked at #3 in March 2026; meanwhile, Vibe Cannabis (MO) holds #1 with a 20.7% YoY sales increase and Proper Cannabis rose from #3 to #2 with 23.6% YoY growth, while Head Change advanced to #4 even as its sales fell 13.1% YoY and Elevate slipped from #2 to #5 with a 41.8% YoY decline. The contrast between Infinity (MO)’s rank drop of 8 places YoY and competitors’ upward or stabilized positions indicates share is consolidating at the top, implying Infinity (MO)’s trajectory points to a need for regain strategies where rank volatility is increasingly penalizing mid-tier brands.
Notable Products
Day Drinker Wax (1g) posted the steepest movement in September 2026 with a -68.6% month-over-month drop and sat at rank 8, signaling a sharp pullback even as Smackin' Cured Wax (1g) rose 25.5% to rank 1. Smackin' Cured Wax (1g) and GMO Cured Shatter (1g) gained 25.5% and 22.0% respectively while Trop Cheese Live Resin Cartridge (0.5g) was effectively flat at +0.3% in rank 4, concentrating momentum at the top despite one major decliner. With eight of the top ten in Concentrates and only one Vapor Pens SKU in the top five, the mix points to deliberate focus on Concentrates where rank 1 and rank 5 both grew while pruning or deprioritizing underperforming lines, reinforced by Day Drinker Wax (1g)’s contraction against a $7.4k finish.
Top Selling Cannabis Brands






Data for this report comes from real-time sales reporting by participating cannabis retailers via their point-of-sale systems, which are linked up with Headset’s business intelligence software. Headset’s data is very reliable, as it comes digitally direct from our partner retailers. However, the potential does exist for misreporting in the instance of duplicates, incorrectly classified products, inaccurate entry of products into point-of-sale systems, or even simple human error at the point of purchase. Thus, there is a slight margin of error to consider. Brands listed on this page are ranked in the top twenty within the market and product category by total retail sales volume.

