.svg)

Sep-2026
Sales
Trend
6-Month
Product Count
SKUs
Avg Price
YoY Sales Change
YoY Price Change


Where to Buy
Amaze Cannabis is stocked at 166 licensed dispensaries across Missouri, Kentucky, and Oklahoma, 162 of them in Missouri, with the deepest coverage in Kansas City, St. Louis, Columbia, Springfield, and Cape Girardeau. Search by ZIP code or city below to find the closest one, or filter by product type if you are after a specific format.
Market Insights Snapshot
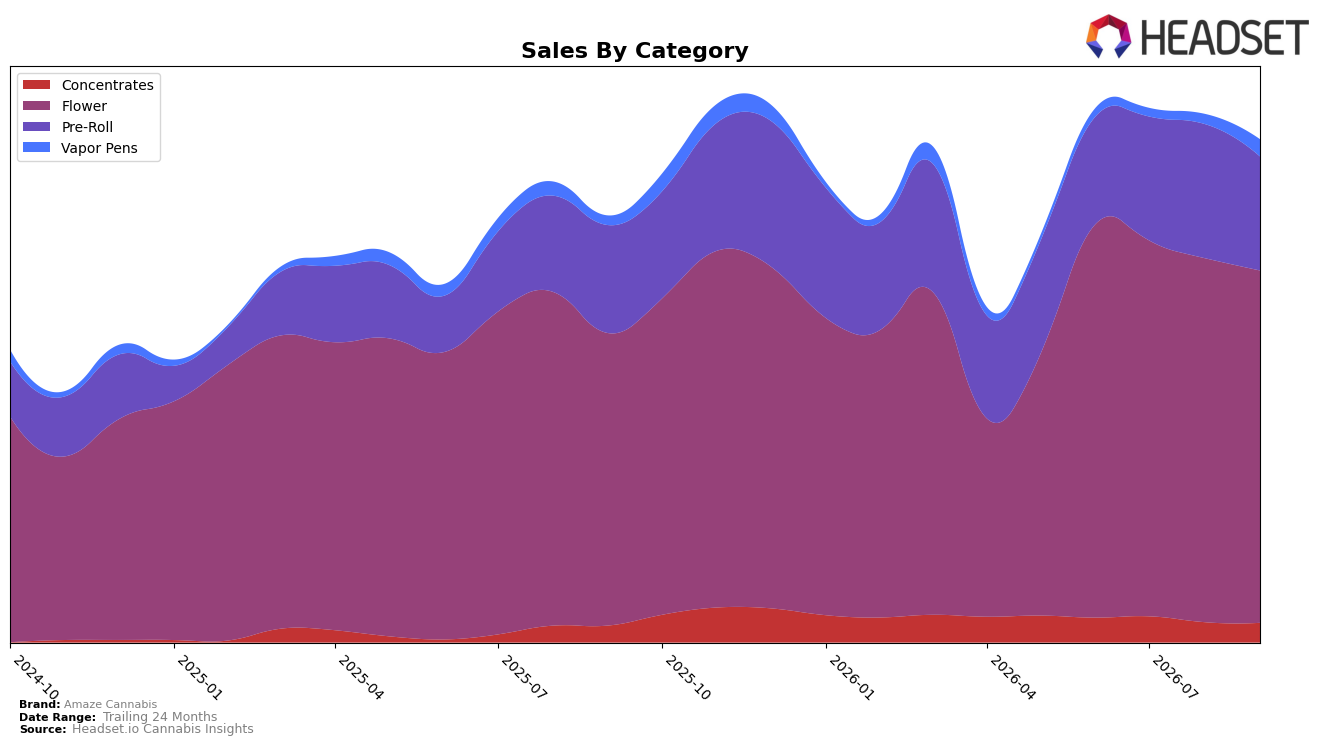
Amaze Cannabis concentrated two-thirds of September 2026 sales in Flower at 66.54% share with 19.78% year-over-year growth but a 3.12% month-over-month dip, while Pre-Roll held 22.83% share with 5.09% year-over-year growth and a sharper 13.92% month-over-month decline. Vapor Pens, though only 5.08% of mix, surged 37.88% year-over-year and 34.40% month-over-month, contrasting with Concentrates at 5.54% share that rose 9.83% year-over-year but slipped 2.09% month-over-month. With a number 2 rank in Flower in Missouri and an 8.35% year-over-year drop in average price to $21.94, the pattern implies a deliberate shift to defend Flower share while leaning into higher-velocity Vapor Pens to offset Pre-Roll softness.
The mix shifts imply Amaze Cannabis is anchoring its positioning around Flower leadership in Missouri at rank 2 while reallocating promotional or shelf focus toward Vapor Pens where a 34.40% month-over-month increase suggests faster trial conversion than in Pre-Roll’s 13.92% month-over-month contraction. The combination of a 19.78% year-over-year Flower lift alongside a 37.88% year-over-year Vapor Pens spike indicates a barbell between core volume and an upswing format, and the 8.35% year-over-year average price reduction signals a pricing posture aimed at widening basket reach rather than trading up, which implies near-term share defense with selective format-led growth rather than broad premiumization.
Competitive Landscape
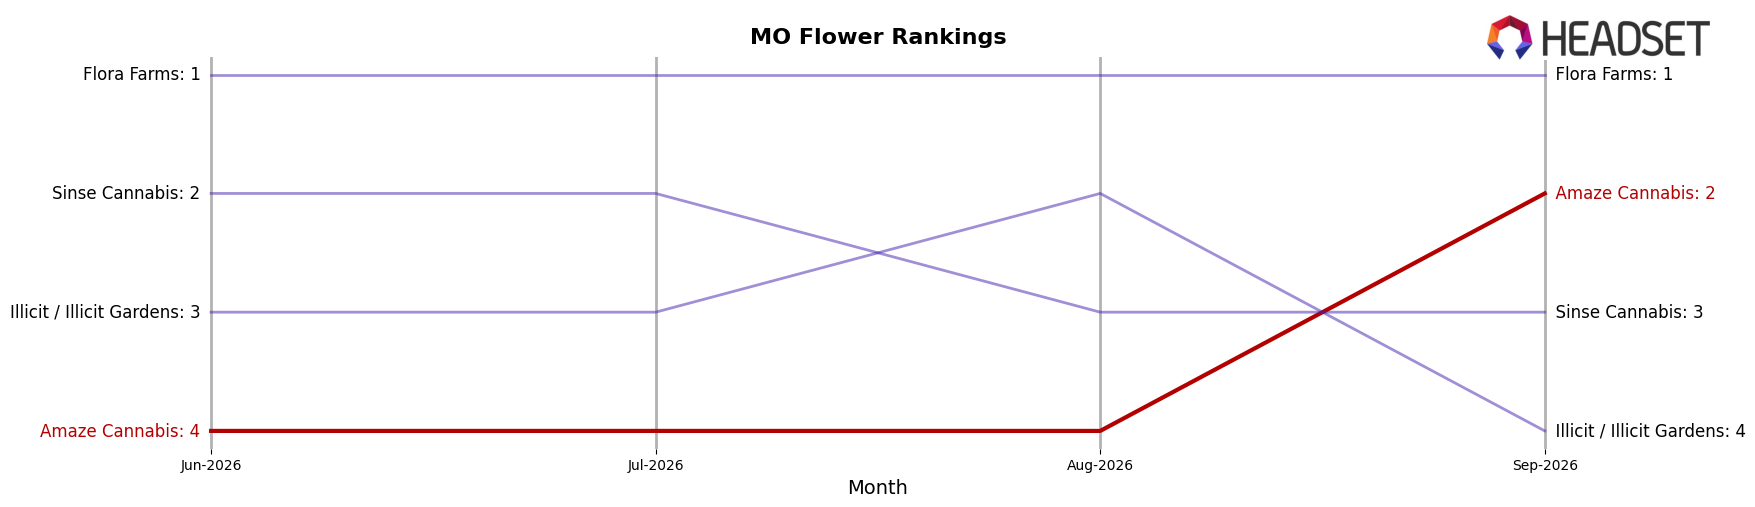
Amaze Cannabis sits at rank #2 in MO Flower in September 2026, up 4 positions from #6 year over year and up 2 positions from #4 in June 2026, marking a new peak at #2 in September 2026 while trailing Flora Farms which held #1 both year over year and in September 2026; compared with Sinse Cannabis slipping to #3 with an 11.1% YoY sales decline and Vibe Cannabis (MO) rising to #5 with a 16.4% YoY sales increase, Amaze Cannabis’s ascent from #6 to #2 within 12 months and from #4 to #2 over the past three months indicates sustained share capture and a credible path to contest the #1 position if momentum persists.
Notable Products
Mule Fuel (3.5g) posted the steepest decline in September 2026 at -36.6% MoM while sliding to rank 3, whereas Spritzer (3.5g) also fell -10.1% MoM at rank 6, indicating pressure within mid-tier Flower even as the leaderboard reshuffled. Triple Burger (3.5g) surged +76.3% MoM to rank 1 and anchored the month with $493,209, and Triple Burger Live Hash Rosin Cartridge (0.5g) rose +48.7% MoM at rank 4, signaling momentum for the Triple Burger franchise across formats. Four of the top ten are Flower SKUs, and within that set Cap Junky (3.5g) slipped -4.3% MoM at rank 2 while Cadillac Rainbow (3.5g) climbed +42.5% MoM at rank 8, pointing to trading within strains rather than a category exit. The pattern implies Amaze Cannabis is consolidating around a flagship strain-led strategy where Triple Burger pulls share across Flower and Vapor Pens while weaker Flower strains are de-emphasized.
Top Selling Cannabis Brands






Data for this report comes from real-time sales reporting by participating cannabis retailers via their point-of-sale systems, which are linked up with Headset’s business intelligence software. Headset’s data is very reliable, as it comes digitally direct from our partner retailers. However, the potential does exist for misreporting in the instance of duplicates, incorrectly classified products, inaccurate entry of products into point-of-sale systems, or even simple human error at the point of purchase. Thus, there is a slight margin of error to consider. Brands listed on this page are ranked in the top twenty within the market and product category by total retail sales volume.

