.svg)

Sep-2026
Sales
Trend
6-Month
Product Count
SKUs
Avg Price
YoY Sales Change
YoY Price Change


Where to Buy
Elevate is stocked at 275 licensed dispensaries across Missouri, Illinois, and 4 other states, 145 of them in Missouri, with the deepest coverage in Kansas City, St. Louis, Springfield, Columbia, and Cape Girardeau. Search by ZIP code or city below to find the closest one, or filter by product type if you are after a specific format.
Market Insights Snapshot
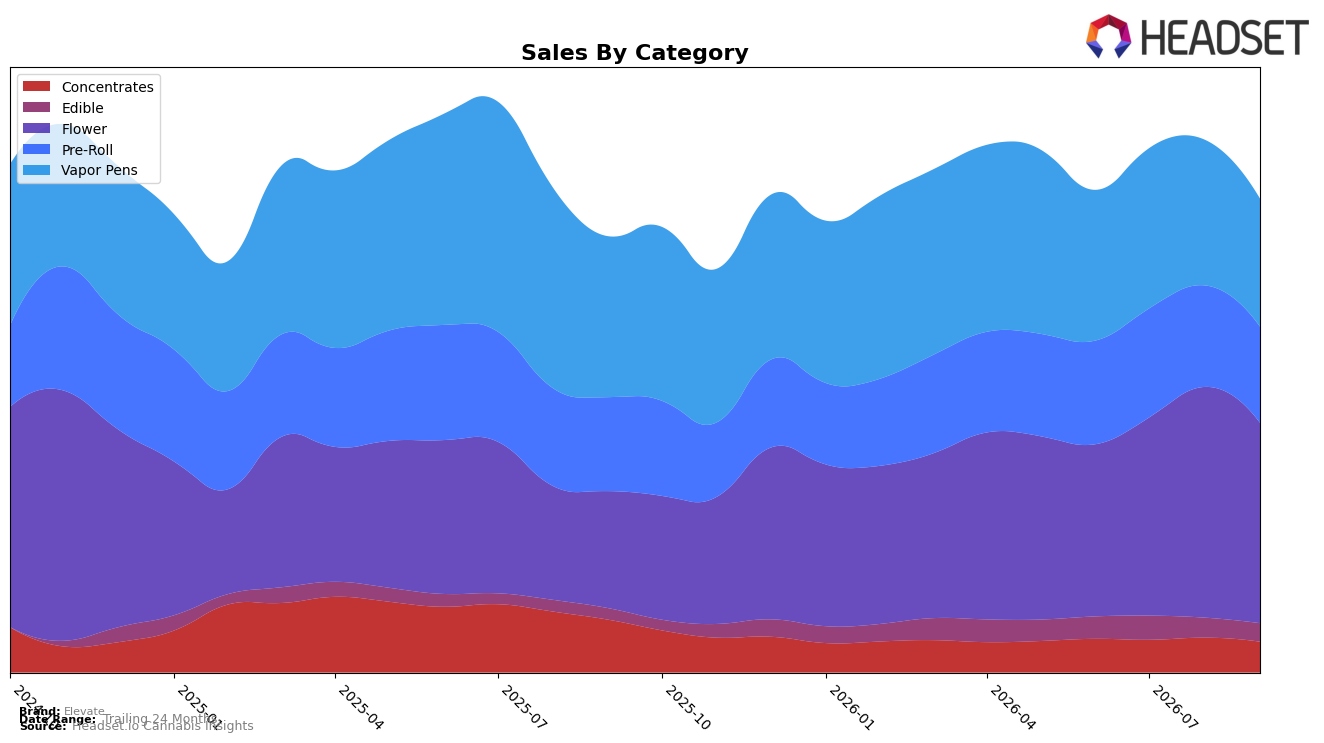
In September 2026, Elevate’s mix tilted further toward Flower at 42.3% share with 71.4% year-over-year growth, even as month-over-month sales in the segment fell 13.2%; meanwhile, Vapor Pens slipped to 27.0% share with a 20.5% year-over-year decline and a 12.2% month-over-month dip. Pre-Roll held 20.3% share with a modest 2.4% year-over-year increase but a 5.3% month-over-month decline, while Edible rose 61.8% year-over-year on a 3.9% share despite a 7.6% month-over-month pullback; Concentrates contracted 41.8% year-over-year and 11.6% month-over-month at 6.5% share. With an average price down 18.1% year-over-year to $27.75 and Flower leading but cooling sequentially, the pattern implies Elevate is trading price for volume in core inhalables while reallocating demand toward lower-priced, higher-velocity formats.
These shifts position Elevate as a value-forward inhalables player anchored in Flower, where a rank of 21 in Missouri suggests room to climb if the 71.4% year-over-year momentum can offset the 13.2% month-over-month volatility. The simultaneous 20.5% year-over-year decline in Vapor Pens and 41.8% drop in Concentrates, alongside a 61.8% Edible lift, indicate portfolio polarization toward accessible price points and simpler formats; combined with an 8.7% brand-level year-over-year sales gain versus a 14.7% two-year decline, the implication is a rebuild strategy leveraging price elasticity and Flower depth to regain share faster than premium-adjacent segments recover.
Competitive Landscape
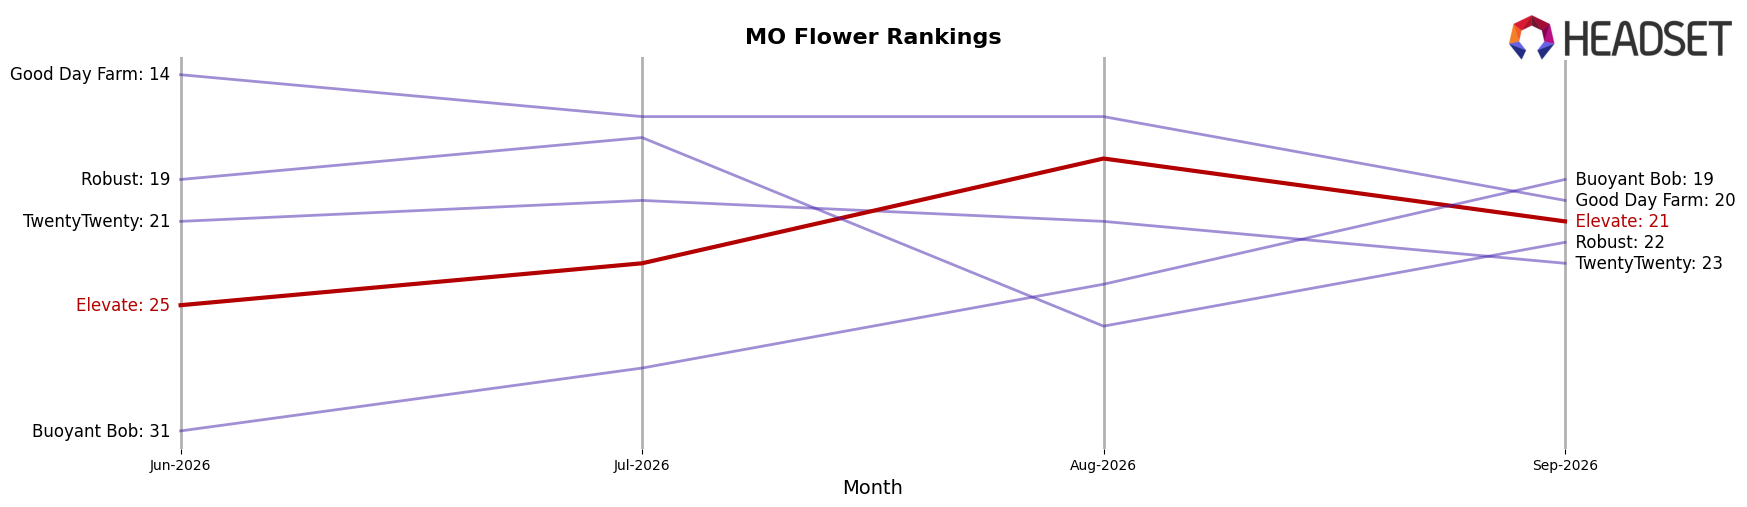
Elevate sits at rank #21 in MO Flower for September 2026, down 4 positions year over year from #17, while improving 4 spots versus June 2026 when it was #25; against this, category leaders tightened their grip as Flora Farms held #1 with a 33.4% year-over-year sales lift and Amaze Cannabis climbed from #6 to #2 with approximately 19.8% growth, contrasting with Sinse Cannabis staying at #3 amid an 11.1% decline. Elevate’s current #21 is far off its peak #8 from November 2024, indicating a multi-quarter erosion in relative position even as short-term gains vs. June 2026 suggest some near-term momentum; the pattern implies that without share-accretive moves, Elevate’s trajectory points to continued mid-pack status as faster-rising rivals consolidate ranks above it.
Notable Products
Slurricane Min-E-Bar Botanical Distillate Disposable (1g) posted the steepest movement in September 2026 with a -42.23% month-over-month drop and slipped to rank 10, while Grease Monkey (3.5g) also contracted by -40.86% and held rank 9; together these declines signal demand rotation away from Vapor Pens and certain Flower SKUs. Love Island (3.5g) rose 19.11% month over month to rank 2 and, alongside AO (3.5g) at rank 3, contributed to a Flower-heavy top ten where six of the top ten are Flower SKUs; this mix points to Elevate concentrating assortment and promotion on core Flower formats over disposables. AO Pre-Roll (1g) led at rank 1 with $30,712 while Pineapple Planet Pre-Roll (1g) at rank 5 reinforces Pre-Roll presence, yet the contrasting -5.24% for Black Maple (3.5g) at rank 4 suggests selective pruning within Flower rather than category retreat. The pattern implies Elevate is pivoting shelf space toward higher-velocity Flower and stable Pre-Rolls while letting underperforming Vapor Pens lapse, consolidating share around a tighter core lineup.
Top Selling Cannabis Brands






Data for this report comes from real-time sales reporting by participating cannabis retailers via their point-of-sale systems, which are linked up with Headset’s business intelligence software. Headset’s data is very reliable, as it comes digitally direct from our partner retailers. However, the potential does exist for misreporting in the instance of duplicates, incorrectly classified products, inaccurate entry of products into point-of-sale systems, or even simple human error at the point of purchase. Thus, there is a slight margin of error to consider. Brands listed on this page are ranked in the top twenty within the market and product category by total retail sales volume.

