.svg)


Market Insights Snapshot
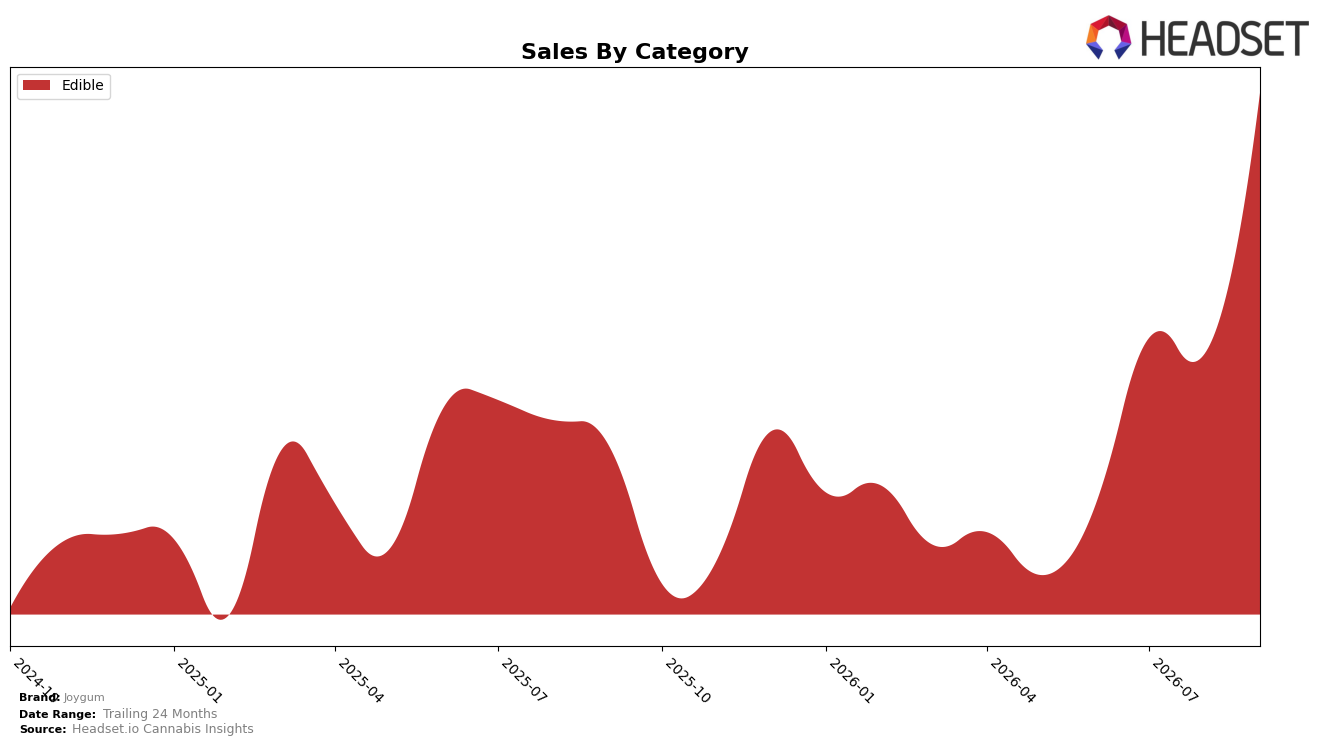
In September 2026, Joygum concentrated 100.0% of sales in Edible, with year-over-year growth of 107.19% and month-over-month growth of 62.30%, while average price rose 6.58% YoY to $18.86. Within Colorado Edible, the brand held rank 23, pairing a triple-digit YoY lift with a double-digit MoM surge, which, taken together, implies that velocity gains rather than assortment expansion drove the mix because no other category contributed share.
The shift toward a single-category footprint alongside a 107.19% YoY rise and a 62.30% MoM spike suggests Joygum’s positioning is consolidating around Edible use-cases where pricing can inch up 6.58% without dampening demand, reinforcing price tolerance and repeat behavior. Holding rank 23 in Colorado while achieving 374.54% sales growth over 24 months signals room to translate momentum into rank gains, implying the next unlock is distribution depth and SKU breadth within Edible rather than cross-category diversification.
Competitive Landscape
Joygum sits at #23 in CO Edible in September 2026, a 11-place climb from #34 year over year and a 5-position gain from #28 three months ago, reaching a new peak rank of #23 in September 2026; meanwhile, Wana advanced from #2 to #1 with +10.5% YoY sales while Wyld slipped from #1 to #2 with -23.8% YoY sales, indicating Joygum’s upward mobility is occurring as a top incumbent loses momentum and another strengthens. The concurrent rise in Joygum’s rank and the divergence between Wana (+10.5%) and Wyld (-23.8%) suggest Joygum is benefiting from share reshuffling at the top while still needing further step-changes to breach the top 20.

Notable Products
Joybomb - CBD/THC 1:1 Sour Berry Blend Chew 40-Pack (100mg CBD, 100mg THC) posted the largest move in September 2026 with +125.6% MoM to rank 2, while Joy Bombs - CBN/THC 1:1 Dream Blends Fruit Chews 40-Pack (100mg CBD, 100mg THC) climbed +101.2% MoM to rank 1, indicating momentum concentrated at the top two slots. In contrast, Joybomb - CBD/THC 1:1 Berry Blend Chews 40-Pack (100mg CBD, 100mg THC) fell -48.8% MoM at rank 3, while Joybombs - Sour Fruit Chews 40-Pack (100mg) rose +121.2% MoM at rank 5, pointing to divergent outcomes within similar pack formats. Four of the top five SKUs are Edible 40-Packs, and the rank spread from 1 to 5 combined with opposing MoM swings over +120% and near -49% suggests a shift toward flavor-specific winners rather than uniform category lift. The product mix implies Joygum is consolidating leadership around dual-cannabinoid 1:1 formulations, using standout flavors to capture share while weaker variants are cycled down.
Top Selling Cannabis Brands






Data for this report comes from real-time sales reporting by participating cannabis retailers via their point-of-sale systems, which are linked up with Headset’s business intelligence software. Headset’s data is very reliable, as it comes digitally direct from our partner retailers. However, the potential does exist for misreporting in the instance of duplicates, incorrectly classified products, inaccurate entry of products into point-of-sale systems, or even simple human error at the point of purchase. Thus, there is a slight margin of error to consider. Brands listed on this page are ranked in the top twenty within the market and product category by total retail sales volume.

