Jun-2026
Sales
Trend
6-Month
Product Count
SKUs
Avg Price
YoY Sales Change
YoY Price Change
Market Insights Snapshot
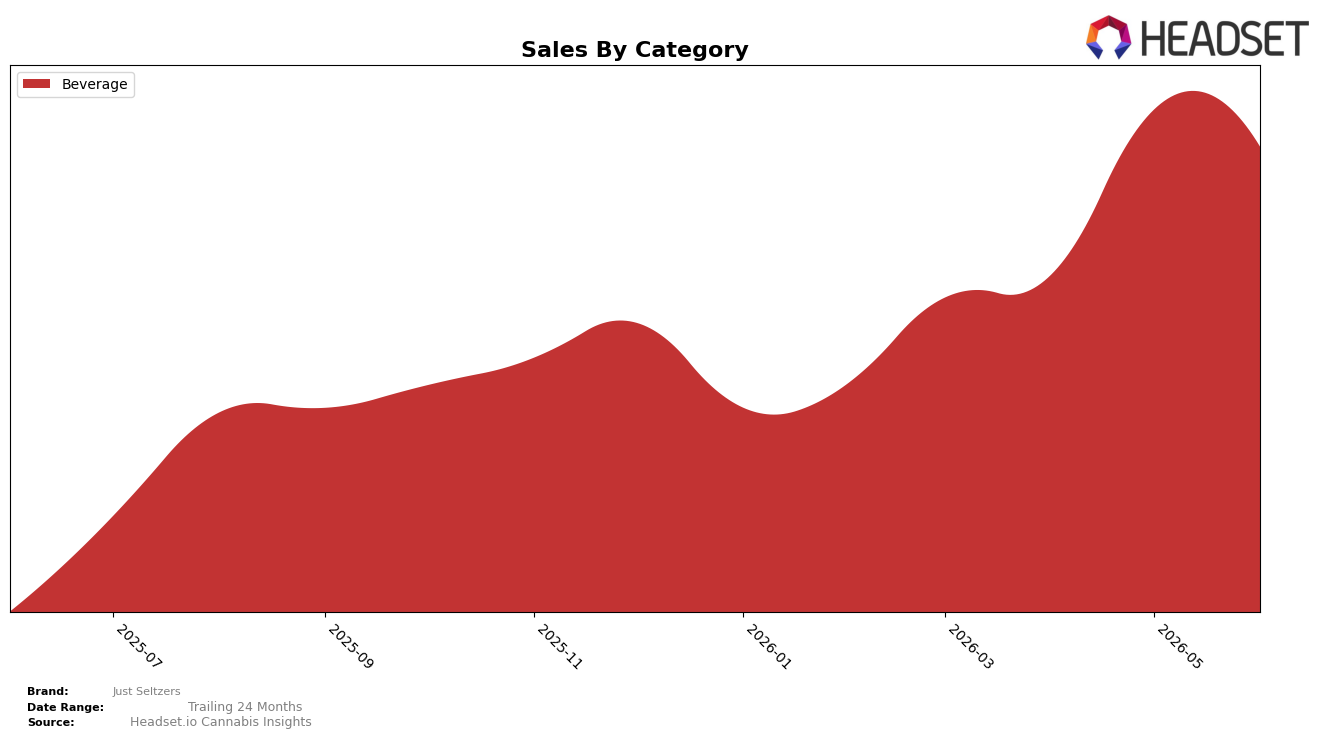
In June 2026, Just Seltzers sat entirely in Beverage with a 100.0% category share, pairing a 3,570.67% year-over-year surge with a -7.16% month-over-month pullback; the average price edged up 1.34% YoY to $5.22 while remaining fully concentrated in the same category. With rank 11 in Beverage within Alberta and a top market in Ontario, the mix shows scale concentrated in a single lane rather than diversification; the implication is that a small MoM decline alongside a triple-digit YoY suggests momentum that is early-cycle and sensitive to near-term velocity shifts.
The combination of a triple-digit YoY expansion at 3,570.67% and a -7.16% MoM dip, alongside a 1.34% YoY price increase, implies the brand is prioritizing volume-led penetration over price-led growth, with market traction anchored in Ontario while competitive visibility at rank 11 in Alberta indicates headroom to climb ranks. The pattern suggests that maintaining Beverage-only focus can sustain share efficiency if activation smooths month-to-month volatility, and that incremental distribution or pack architecture could translate small price flexibility into rank gains without diluting the 100.0% category concentration.
Competitive Landscape
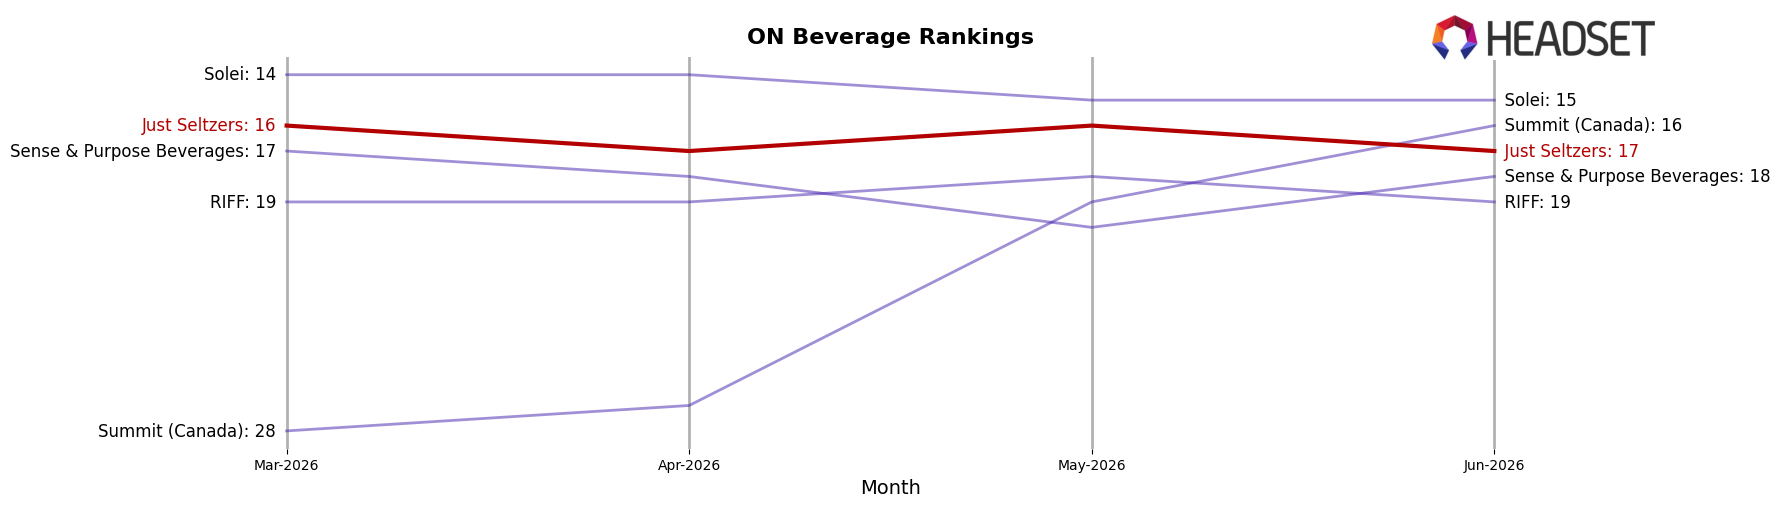
Just Seltzers is #17 in ON Beverage in June 2026, improving 32 ranks from #49 year over year, but slipping 1 position from a peak of #16 in May 2026 to #17 in June 2026, indicating momentum that has recently leveled off. Among competitors, XMG held #1 both this year and last year while its sales fell 37% year over year, and TeaPot advanced from #10 to #5 with a 130% year-over-year sales increase, suggesting that Just Seltzers’ rank gains are outpacing incumbents losing share but trailing brands executing faster climbs. The pattern implies a transitional position: sustained improvement versus last year but without further rank capture since May 2026, so maintaining upward pressure will likely require gains against accelerating mid-pack climbers.
Notable Products
Lite- CBG/THC 2:1 Blackberry Lime Seltzer (5mg CBG, 2.5mg THC, 12oz, 355ml) posted the steepest decline in June 2026 at -17.1% while holding rank 2, and Lite - CBG/THC 2:1 Wildberry Punch Seltzer (5mg CBG, 2.5mg THC, 355ml, 12oz) fell -16.0% but still led at rank 1. In contrast, Peach Mango Seltzer (10mg THC, 12oz, 355ml) rose +16.8% at rank 4 and Cherry Pineapple Seltzer (10mg THC, 12oz, 355ml) in rank 3 edged up +2.3%. Five of the top six are Beverage SKUs with two CBG/THC 2:1 “Lite” entries occupying ranks 1–2, indicating a reliance on lighter-dose formats even as their month-over-month softness contrasts with the +16.8% momentum in a 10mg SKU. The pattern implies Just Seltzers is pivoting toward higher-dose flavor variants for near-term volume stability while the CBG-led Lite tier requires pricing or activation support to defend premium positioning.
Top Selling Cannabis Brands
Data for this report comes from real-time sales reporting by participating cannabis retailers via their point-of-sale systems, which are linked up with Headset’s business intelligence software. Headset’s data is very reliable, as it comes digitally direct from our partner retailers. However, the potential does exist for misreporting in the instance of duplicates, incorrectly classified products, inaccurate entry of products into point-of-sale systems, or even simple human error at the point of purchase. Thus, there is a slight margin of error to consider. Brands listed on this page are ranked in the top twenty within the market and product category by total retail sales volume.

