Jun-2026
Sales
Trend
6-Month
Product Count
SKUs
Avg Price
YoY Sales Change
YoY Price Change
Market Insights Snapshot
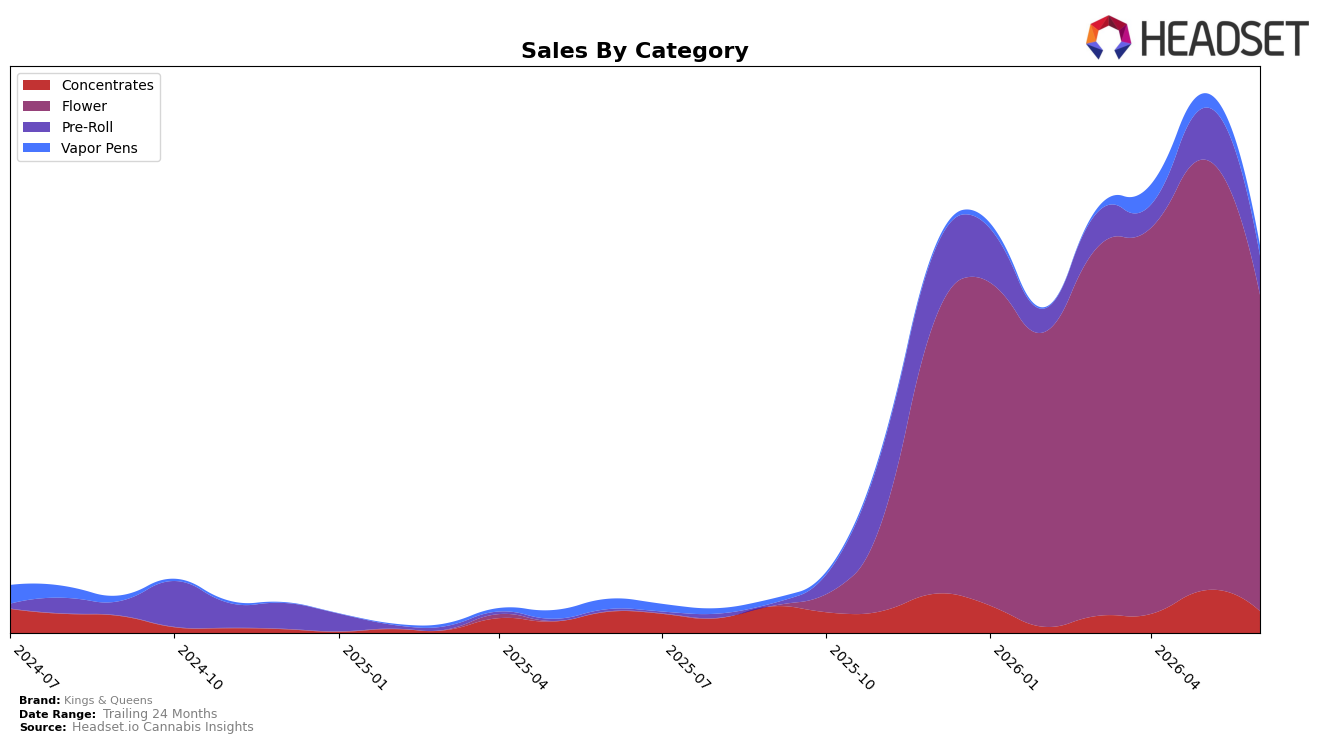
In June 2026, Kings & Queens concentrated 81.81% of sales in Flower while Pre-Roll held 10.07%, indicating a mix anchored to a single category even as month-over-month declines hit across the board. Flower’s month-over-month change was -26.59% with no year-over-year read, while Pre-Roll fell -24.53% month-over-month despite a 1,966.81% year-over-year surge; Concentrates slipped -49.03% month-over-month alongside a modest 3.09% year-over-year gain, and Vapor Pens declined -31.26% month-over-month with a -2.05% year-over-year contraction. With average price down 17.31% year over year to $27.13 and brand-level sales up 1,078.31% year over year, the pattern implies volume-led expansion concentrated in Flower and opportunistic Pre-Roll gains, but with acute short-term pullbacks that expose sensitivity to monthly demand swings.
Given a 40 rank in Flower in New York alongside an 81.81% category share of mix and a -26.59% month-over-month decline in that anchor category, Kings & Queens is positioned as a Flower-first brand with limited insulation from intra-month volatility. The 1,966.81% year-over-year surge in Pre-Roll against a -24.53% month-over-month drop and a 5.60% share in Concentrates coupled with a -49.03% month-over-month change suggest secondary categories remain nascent contributors rather than stabilizers; this implies the path to better placement is increasing repeatable Pre-Roll contribution while moderating price cuts, as a -17.31% year-over-year average price shift has already delivered scale but may cap positioning power if mix remains this concentrated.
Competitive Landscape
Kings & Queens sits at rank #40 in June 2026, unchanged from #40 three months prior, while its peak of #30 in April 2026 marks a 10-position slide since that month; by contrast, Find. rose to #1 with a +3 YoY rank change and +35.6% YoY sales growth, and RYTHM holds #5 with a +10 YoY rank change and +40.6% YoY sales, indicating leaders are gaining share as Kings & Queens stays flat. With Leal at #2 after a +7 YoY rank shift and Dank. By Definition at #3 despite −50.7% YoY sales, the market’s top tier is consolidating positions even amid mixed sales trends, implying Kings & Queens’ rank trajectory—stable quarter to date but down 10 spots from April 2026—signals stalled momentum that risks further share loss if the April peak cannot be re-approached.

Notable Products
Bazooka Haze Infused Nugs (2g) posted the steepest movement in June 2026 with a -57.3% month-over-month drop and slid to rank 9, implying a rapid pullback on an infused niche while the broader lineup shifted toward standard Flower. In contrast, Blueberry Sugar (3.5g) surged +97.4% MoM to rank 1 with approximately $53,379 in sales, and Zours (3.5g) added +3.1% MoM while holding rank 5, marking a split between premium momentum and value stability. Eight of the top ten SKUs are Flower, and five sit in ranks 1–5, indicating a consolidation of demand at the top of the Flower ladder alongside a de-emphasis of infused formats. The pattern implies Kings & Queens is concentrating velocity in a few headline Flower strains while pruning or repositioning underperforming infused offerings.
Top Selling Cannabis Brands
Data for this report comes from real-time sales reporting by participating cannabis retailers via their point-of-sale systems, which are linked up with Headset’s business intelligence software. Headset’s data is very reliable, as it comes digitally direct from our partner retailers. However, the potential does exist for misreporting in the instance of duplicates, incorrectly classified products, inaccurate entry of products into point-of-sale systems, or even simple human error at the point of purchase. Thus, there is a slight margin of error to consider. Brands listed on this page are ranked in the top twenty within the market and product category by total retail sales volume.

