.svg)

Sep-2026
Sales
Trend
6-Month
Product Count
SKUs
Avg Price
YoY Sales Change
YoY Price Change


Where to Buy
Momenta is stocked at 69 licensed dispensaries across Pennsylvania, Maryland, and 2 other states, 35 of them in Pennsylvania, with the deepest coverage in Philadelphia, Pittsburgh, Hanover, Lancaster, and Montgomeryville. Search by ZIP code or city below to find the closest one, or filter by product type if you are after a specific format.
Market Insights Snapshot
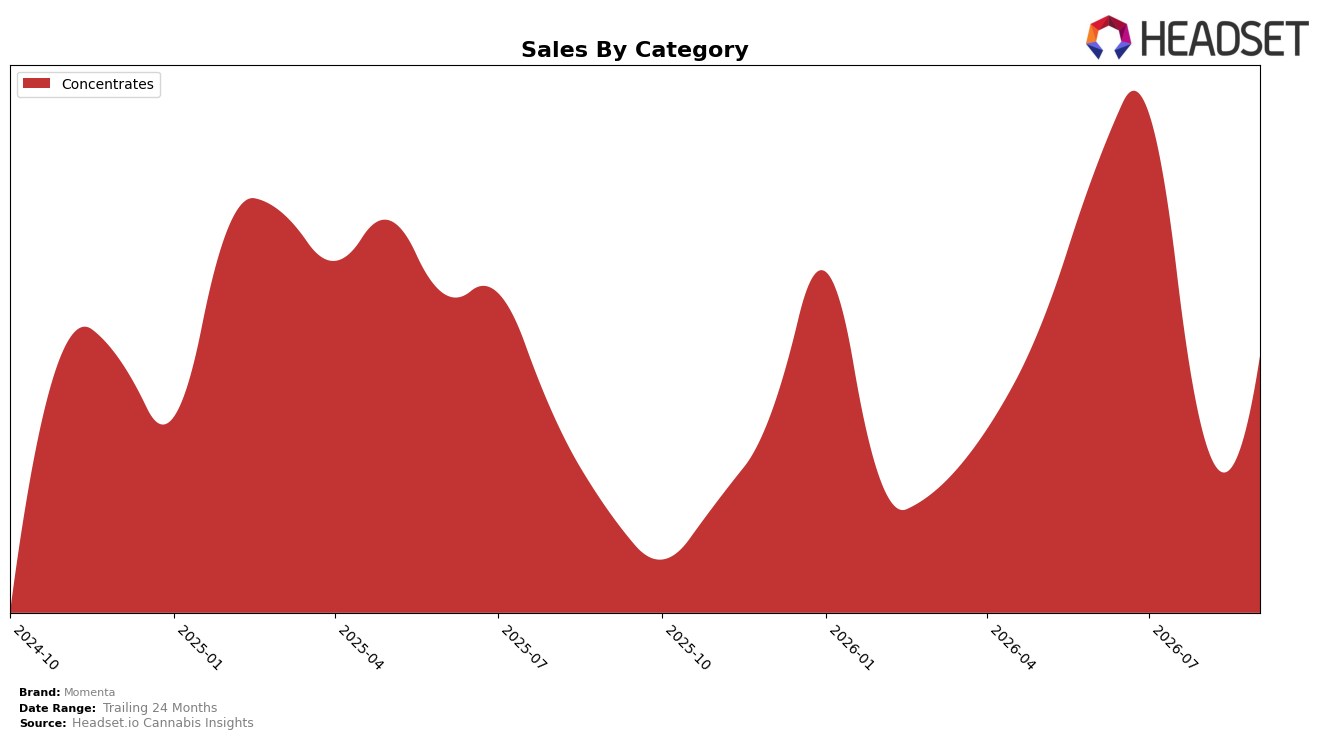
In September 2026, Momenta operated as a single-category brand with Concentrates at 100.0% of sales mix, posting year-over-year growth of 72.24% and month-over-month growth of 29.07%. Average price moved down 1.93% YoY to $39.56 while sales scaled 336.13% over 24 months, and the brand held rank 33 in Concentrates in Maryland. This concentration implies a deliberate deepening in one category where momentum is accelerating MoM while price is softening YoY, signaling a volume-led expansion path rather than a price-led one.
The combination of 100.0% category reliance and a rank of 33 in Maryland suggests headroom exists if the 29.07% MoM cadence can convert into rank gains without eroding price beyond the current 1.93% YoY decline. With 72.24% YoY growth coexisting with a flat-to-declining price point and a 336.13% two-year trajectory, the brand’s positioning skews toward capturing incremental share through velocity in Concentrates rather than diversification, implying that short-term gains hinge on sustaining repeat purchase and retail penetration within this single segment.
Competitive Landscape
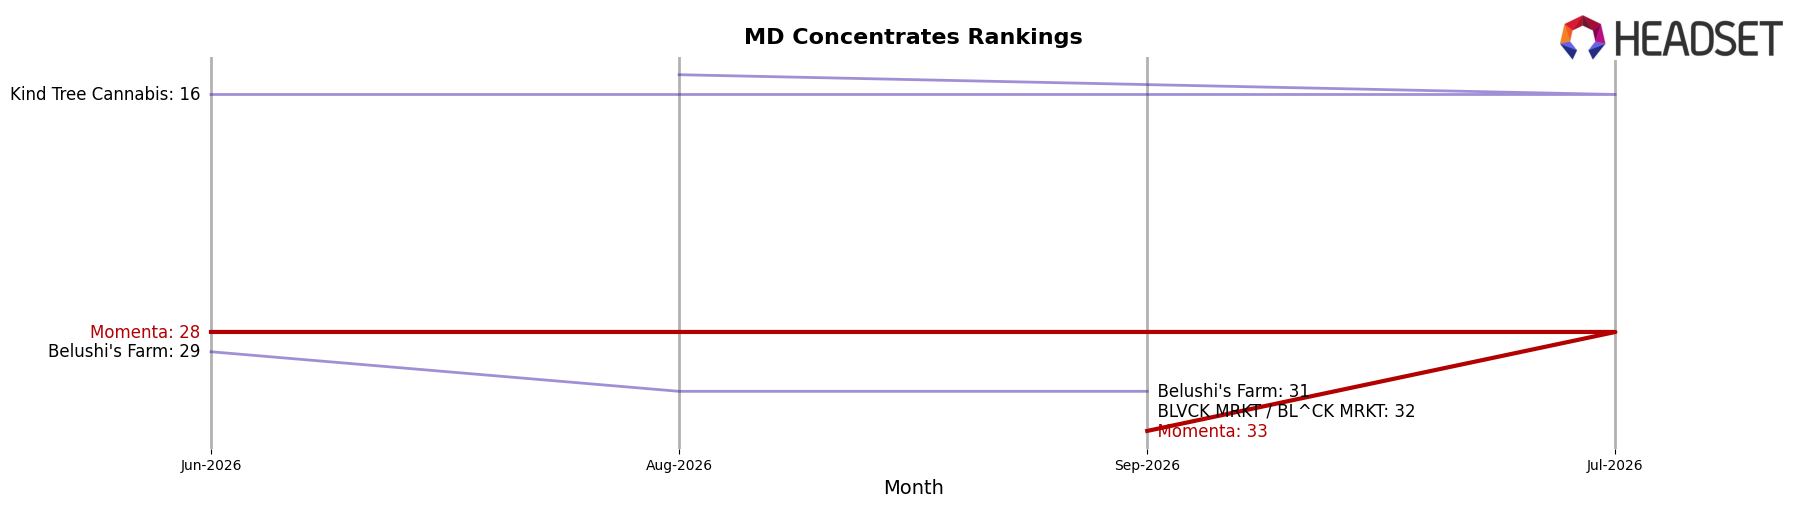
Momenta sits at rank #33 in MD Concentrates in September 2026, down 5 positions year over year from #28, and also 5 positions below its June 2026 three-month reference at #28; against that slide, the brand remains 8 spots off its historical peak of #25 from July 2025, indicating a multi-quarter drift rather than a single-month blip. Competitive pressure is acute at the top: District Cannabis holds #1 with a 0-position YoY change and 46.4% YoY sales growth, while Grassroots climbed from #4 to #2 alongside 41.6% YoY sales growth; in contrast, Momenta’s 5-rank YoY decline alongside a 5-rank drop from its three-month marker signals that category share is consolidating upward into leaders with double-digit growth. The pattern implies Momenta’s rank trajectory is weakening into the low-30s and, absent a reversal, risks further share loss as leaders expand their gap.
Notable Products
Member Berry RSO Syringe (1g) delivered the headline move in September 2026 with +441.6% MoM and a jump into rank 2, outpacing the next-fastest riser by more than 200 percentage points and eclipsing Firecracker RSO Syringe (1g), which plunged -84.6% MoM to rank 6. Thunder Punch RSO Syringe (1g) held rank 1 with +10.3% MoM, while Colonial Kush RSO Syringe (1g) advanced +68.0% MoM to rank 3, signaling that three of the top five are being driven by outsized syringe demand. With all named items in Concentrates and at least four of the top ten sitting in the RSO Syringe format, the mix tilts toward a concentrated SKU strategy that favors rapid share capture at the top of the ranking.
Top Selling Cannabis Brands






Data for this report comes from real-time sales reporting by participating cannabis retailers via their point-of-sale systems, which are linked up with Headset’s business intelligence software. Headset’s data is very reliable, as it comes digitally direct from our partner retailers. However, the potential does exist for misreporting in the instance of duplicates, incorrectly classified products, inaccurate entry of products into point-of-sale systems, or even simple human error at the point of purchase. Thus, there is a slight margin of error to consider. Brands listed on this page are ranked in the top twenty within the market and product category by total retail sales volume.

