Dec-2025
Sales
Trend
6-Month
Product Count
SKUs
Avg Price
YoY Sales Change
YoY Price Change
Market Insights Snapshot
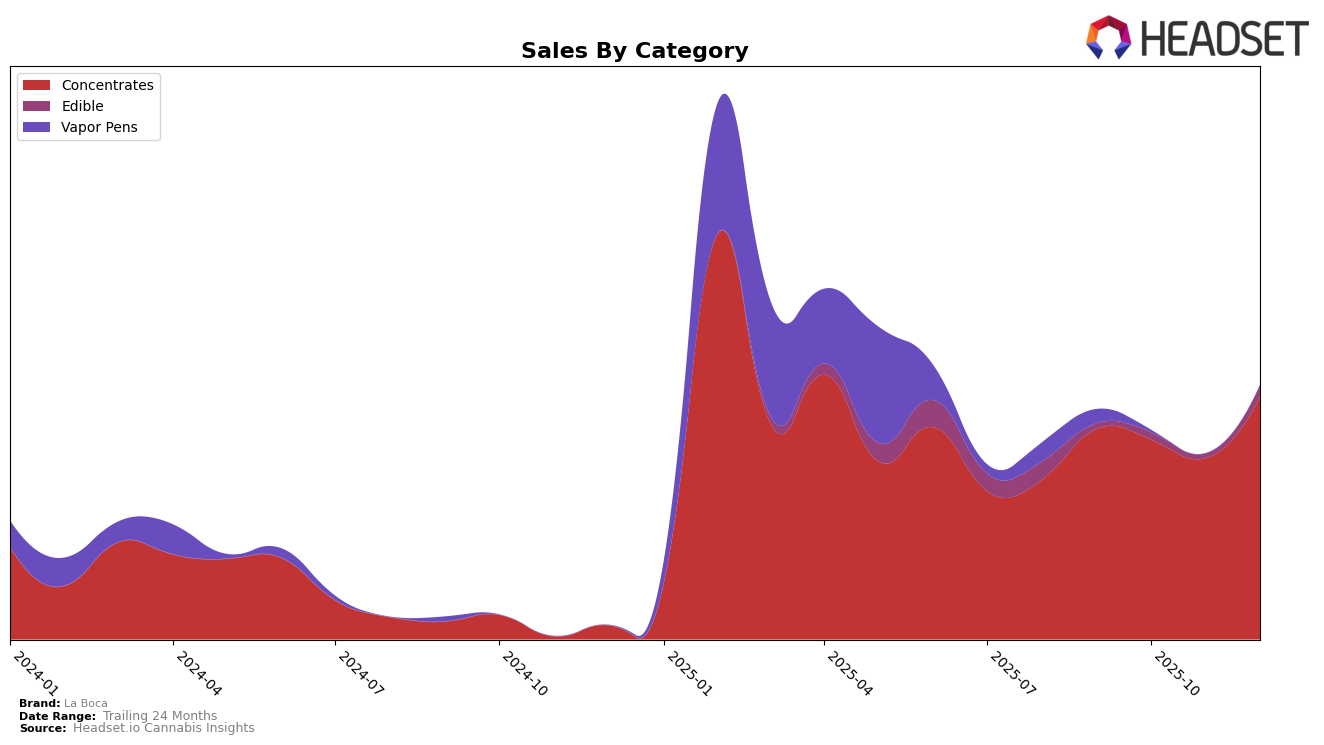
La Boca has shown a notable upward trajectory in the Alberta market within the Concentrates category. Over the last four months of 2025, the brand's ranking improved from 41st in September to 26th by December, indicating a consistent climb in popularity and market penetration. This positive trend is bolstered by a significant increase in sales, particularly from November to December where sales jumped from 19,110 to 30,886. Such a leap suggests a strong consumer response and possibly successful marketing strategies or product offerings that resonate well with the Alberta audience.
In contrast, La Boca's performance in the Ontario market presents a more challenging picture. The brand did not secure a position within the top 30 in the Concentrates category for November and December, indicating a potential struggle to maintain competitiveness or market share in this province. This absence from the top rankings suggests that La Boca may need to reassess its strategies or offerings to better align with consumer preferences in Ontario. The drop in sales from 16,925 in September to 13,449 in October further emphasizes the need for a strategic pivot to regain traction in this market.
Competitive Landscape
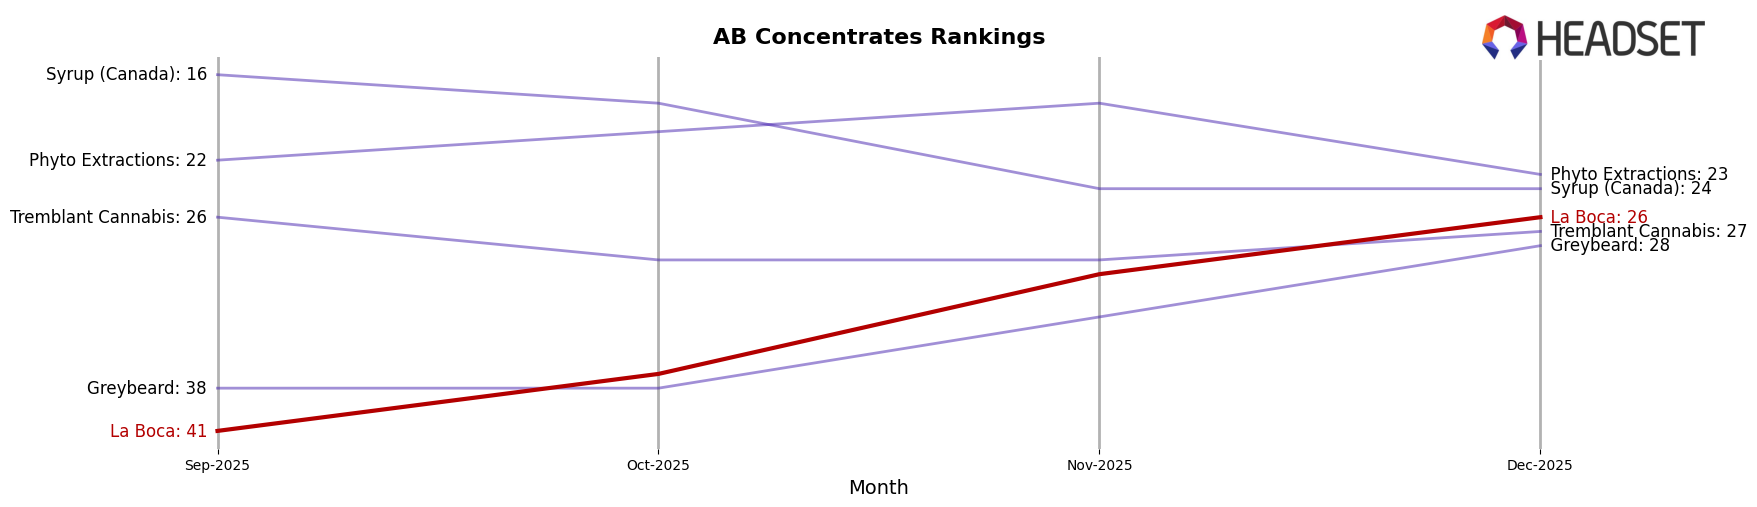
In the Alberta concentrates market, La Boca has shown a notable upward trajectory in brand ranking, moving from the 41st position in September 2025 to 26th by December 2025. This improvement in rank is accompanied by a significant increase in sales, indicating a strong market presence and growing consumer preference. In contrast, Phyto Extractions experienced fluctuations, peaking at 18th in November before dropping to 23rd in December, suggesting potential volatility in their market strategy. Meanwhile, Greybeard re-entered the top 30 in December after being absent in November, which could signal a recovery or seasonal demand. Tremblant Cannabis maintained a relatively stable position, hovering around the 27th rank, while Syrup (Canada) saw a decline from 16th in September to 24th in December, reflecting a decrease in sales momentum. These dynamics highlight La Boca's strategic gains in a competitive landscape, potentially setting the stage for further market penetration and sales growth.
Notable Products
In December 2025, the top-performing product for La Boca was Top Shelf Live Rosin 1g, maintaining its number one rank from the previous month, with sales reaching 380 units. Live Resin Series - Hybrid La Boca Live Resin 1g held steady at the second position, showing improvement from its drop to the second rank in November. Sour Blue Raz Soft Chews 2-Pack 10mg rose to third place, a significant jump from fifth position in November. Sour Watermelon Live Rosin Gummies 2-Pack 10mg maintained its third-place ranking from November, showcasing consistent sales performance. Do-Si-Dos x Purple Punch Live Resin 1g slipped to fourth place, down from its third position in November, indicating a slight decline in sales momentum.
Top Selling Cannabis Brands
Data for this report comes from real-time sales reporting by participating cannabis retailers via their point-of-sale systems, which are linked up with Headset’s business intelligence software. Headset’s data is very reliable, as it comes digitally direct from our partner retailers. However, the potential does exist for misreporting in the instance of duplicates, incorrectly classified products, inaccurate entry of products into point-of-sale systems, or even simple human error at the point of purchase. Thus, there is a slight margin of error to consider. Brands listed on this page are ranked in the top twenty within the market and product category by total retail sales volume.

