.svg)

Sep-2026
Sales
Trend
6-Month
Product Count
SKUs
Avg Price
YoY Sales Change
YoY Price Change


Where to Buy
Pabst Labs is stocked at 472 licensed dispensaries across California, with the deepest coverage in Los Angeles, San Diego, San Francisco, Santa Ana, and Sacramento. Search by ZIP code or city below to find the closest one, or filter by product type if you are after a specific format.
Market Insights Snapshot
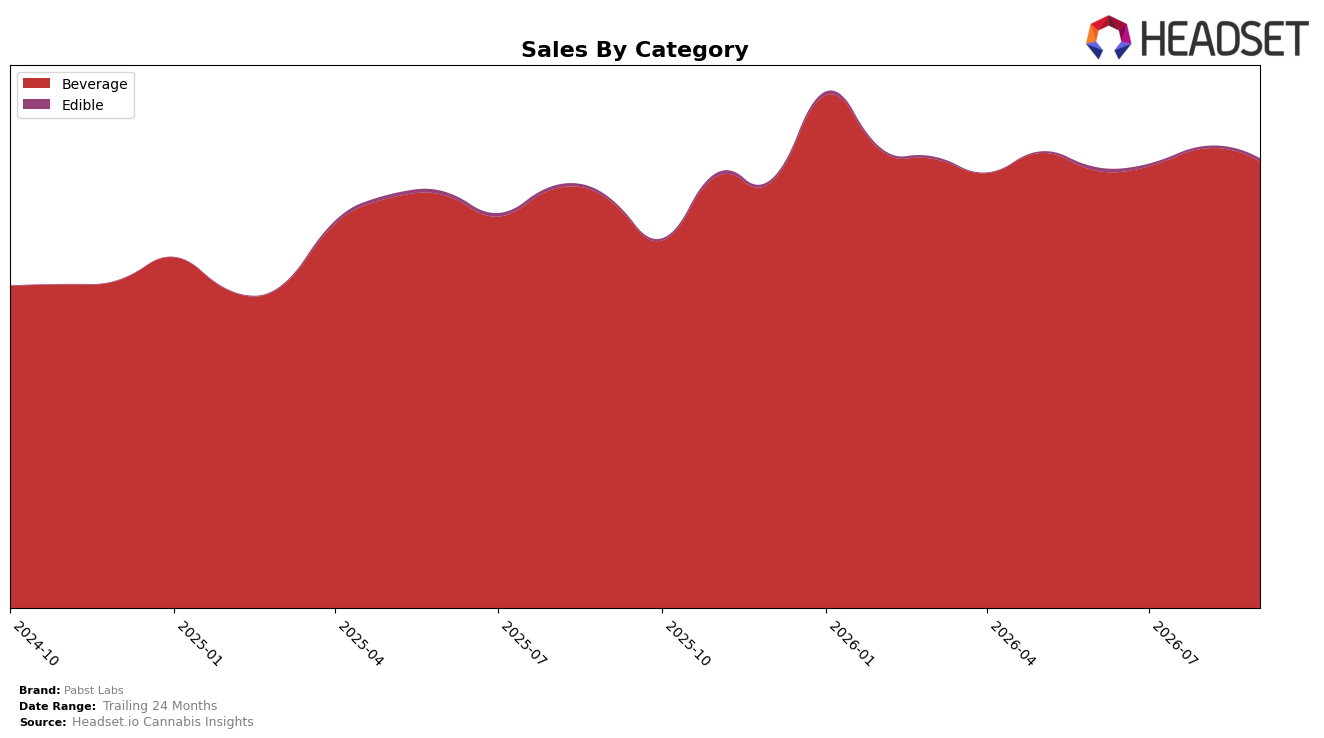
Pabst Labs is concentrated in Beverage at 99.37% share, where September 2026 growth ran 9.28% year over year but fell 2.81% month over month, while the much smaller Edible line at 0.63% share advanced 23.39% YoY and 35.70% MoM. Average price for the brand declined 1.02% YoY to $7.13, with Beverage priced at $7.10 versus Edible at $16.15, and within California Beverage the brand sat at rank 6. The pattern implies a near-single-category footprint that is stabilizing via price ease and modest YoY growth, while outsized Edible momentum off a small base offers a lever for incremental diversification without diluting the Beverage core.
With Beverage down 2.81% MoM but still delivering 9.28% YoY, and Edible up 35.70% MoM alongside 23.39% YoY, the month’s mix shift points to short-term softness in the core offset by emerging trial in higher-priced Edibles. Holding rank 6 in California Beverage suggests room to trade share if the 1.02% YoY price deflation continues to aid velocity, while the 0.63% Edible share indicates early-stage expansion where targeted assortment could convert momentum into a measurable share line. The implication is that pricing and promotional focus in Beverage should defend placement and rank while selective Edible scaling can create a second growth pillar that reduces reliance on single-category cyclicality.
Competitive Landscape
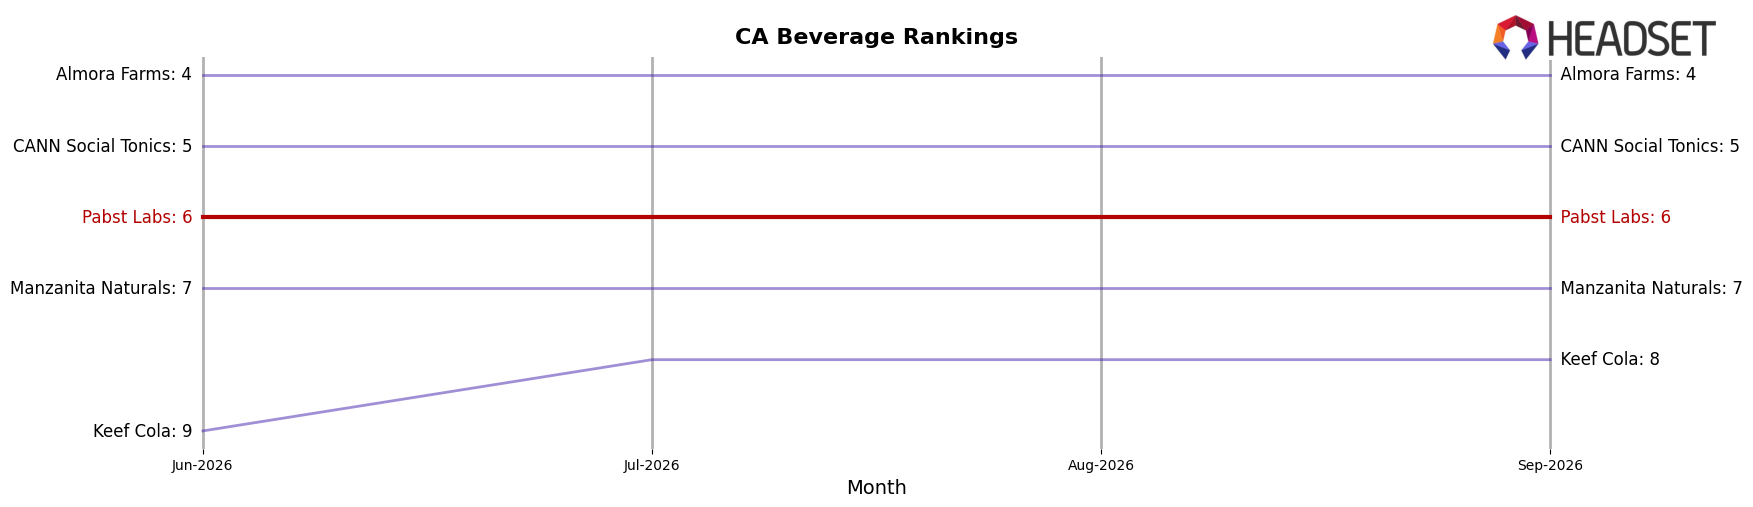
Pabst Labs sits at rank #6 in CA Beverage in September 2026, down 2 positions year over year from #4, and flat versus June 2026 at #6, while its peak of #4 in February 2026 marks a 2-rank slide since then; in contrast, CANN Social Tonics advanced from #9 to #5 with 340.8% YoY sales growth and Almora Farms moved from #6 to #4 with 76.1% YoY sales growth, indicating that faster-rising mid-pack competitors are overtaking Pabst Labs as the category’s momentum concentrates above rank #6.
Notable Products
Watermelon Melon Soda Pop 4-Pack (25mg THC, 12oz) delivered the standout move in September 2026 with a 142.3% month-over-month surge, climbing into rank 7 while Strawberry Kiwi High Seltzer (10mg THC, 12oz, 355ml) fell 38.7% to rank 6. At the top, High Seltzer - THC/THCV 2:1 Daytime Energy Guava Seltzer (10mg THC, 5mg THCV, 12oz) slipped 8.6% but still held rank 1, whereas Cherry Limeade Soda Pop (25mg THC, 12oz, 355ml) dropped 15.1% at rank 2; taken together with Lemon High Seltzer (10mg THC, 12oz) rising 11.9% at rank 3, the mix shows premium single-serve volatility offset by selective flavor momentum. Four of the top ten are 4-Pack formats, with Cherry Limeade Soda 4-Pack (100mg, 12oz, 355ml) up 19.4% at rank 8 while High Seltzer - THC/THCV 2:1 Daytime Energy Guava Seltzer 4-Pack (40mg THC, 20mg THCV, 12oz, 355ml) slid 17.3% at rank 9; the divergence implies shoppers are trading into value packs where taste profiles align and rejecting multi-serve extensions that don’t match single-serve favorites. The pattern implies Pabst Labs is pivoting toward a portfolio where value-pack wins in bold fruit flavors absorb softness in functional or THCV-led variants, concentrating growth in multi-serve offerings rather than relying on flagship single cans.
Top Selling Cannabis Brands






Data for this report comes from real-time sales reporting by participating cannabis retailers via their point-of-sale systems, which are linked up with Headset’s business intelligence software. Headset’s data is very reliable, as it comes digitally direct from our partner retailers. However, the potential does exist for misreporting in the instance of duplicates, incorrectly classified products, inaccurate entry of products into point-of-sale systems, or even simple human error at the point of purchase. Thus, there is a slight margin of error to consider. Brands listed on this page are ranked in the top twenty within the market and product category by total retail sales volume.

