.svg)

Jun-2026
Sales
Trend
6-Month
Product Count
SKUs
Avg Price
YoY Sales Change
YoY Price Change


Where to Buy
Lavinia is stocked at 53 licensed dispensaries across California, with the deepest coverage in Los Angeles, Sacramento, San Francisco, Santa Rosa, and Adelanto. Search by ZIP code or city below to find the closest one, or filter by product type if you are after a specific format.
Market Insights Snapshot
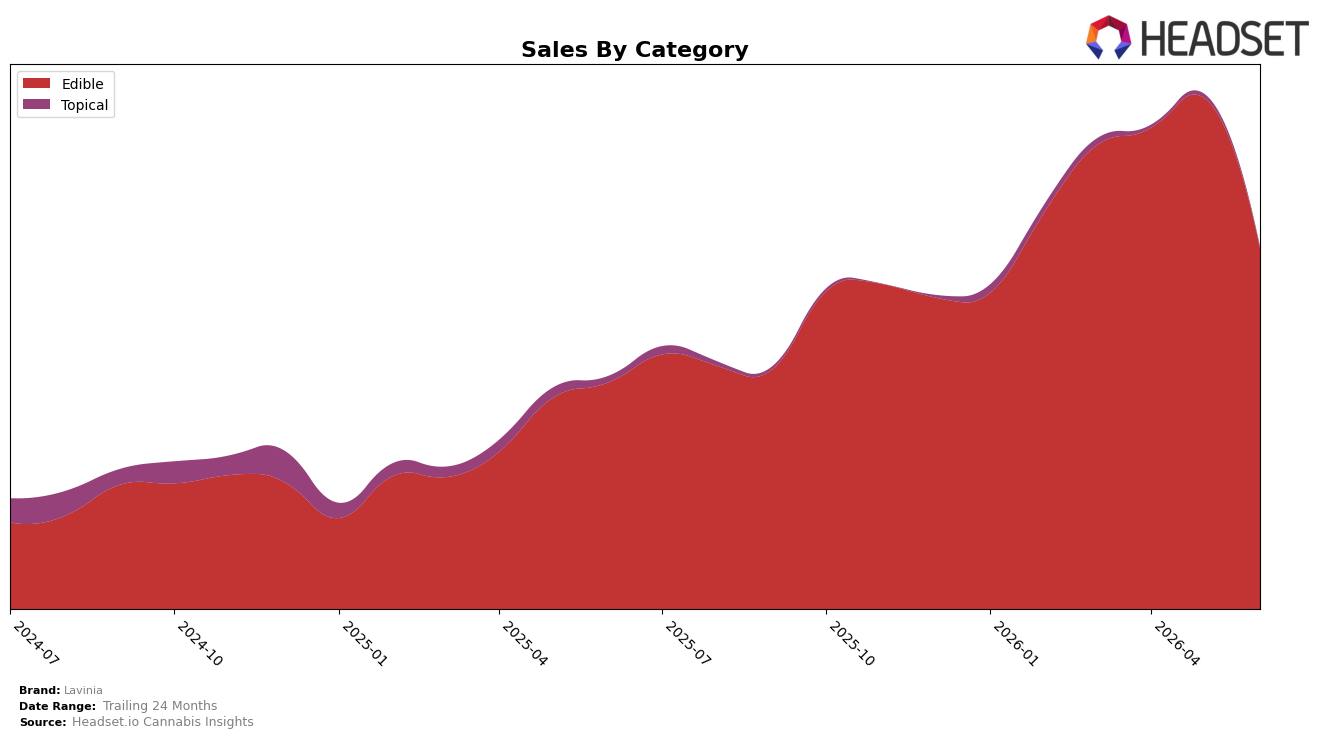
In June 2026, Lavinia concentrated 99.60% of sales in Edible, with Topical reduced to 0.40% share, indicating a narrowed category footprint. Edible grew 59.45% year over year while declining 29.31% month over month, whereas Topical fell 77.50% year over year and 64.81% month over month, pointing to simultaneous consolidation and volatility. The brand’s average price rose 3.05% year over year to $16.08, and within Edible the average price held near $16.04, suggesting price stability despite mix contraction. The pattern implies Lavinia is prioritizing scale in Edible at the expense of Topical, trading broader category presence for depth even as near-term MoM softness introduces execution risk.
Positioning-wise, a 59.45% year-over-year rise in Edible alongside a 29.31% month-over-month pullback places Lavinia as an Edible‑led brand balancing expansion with exposure to monthly demand swings; the 0.40% Topical share and its 77.50% year-over-year decline signal a de-emphasis of wellness-adjacent formats. Holding the Edible average price near $16.04 while the brand average climbed 3.05% suggests disciplined pricing that avoids premium drift, supporting volume capture over margin maximalism. With an Edible rank of 36 in California, the mix tilt and two-directional growth pattern imply a mid‑pack presence anchored in one category, where gaining rank will depend more on stabilizing monthly comp swings than on further category diversification.
Competitive Landscape
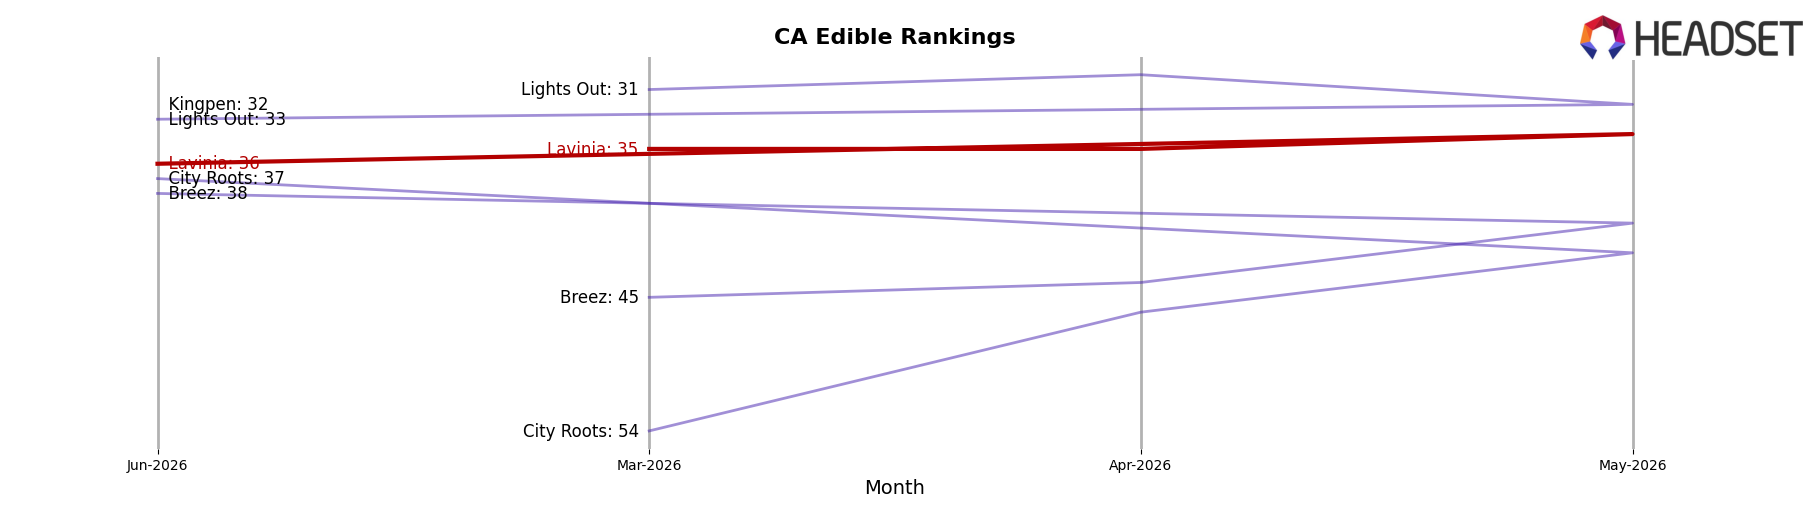
Lavinia sits at rank #36 in CA Edible for June 2026, improving 16 positions from #52 year over year, while slipping 1 place from March 2026’s #35 and coming off a peak of #34 in May 2026; this puts Lavinia well below Wyld holding #1 despite a -1.9% YoY sales change and below Camino steady at #2 with a 12.9% YoY sales increase. The contrast widens with Kanha / Sunderstorm fixed at #3 alongside a 10.9% YoY lift and Good Tide anchored at #5 with a 28.5% YoY gain, indicating top-tier stability even as Lavinia’s middle-tier movement remains within a tight three-rank band from #35 to #34 to #36. The pattern implies Lavinia is consolidating into the mid-30s rather than breaking into the top 30, so further share capture will likely require displacing stable leaders rather than relying on drift within the mid-pack.
Notable Products
Watermelon Gummies 2-Pack (20mg) posted the largest movement in June 2026 with +188% month over month to rank 6, while Before Sleep - Peach-Mango Gummies 10-Pack (100mg) fell 44% to rank 3. At the top, Before Sex - Watermelon Live Resin Gummies 10-Pack (100mg) declined 25% yet held rank 1, and Before Sex - Orange Creamsicle Resin Gummies 10-Pack (100mg) dropped 13% at rank 2; five of the top six are Edible SKUs, signaling concentration in gummies over other formats. The steep 62% slide for Before Sex - Peach-Mango Gummies 10-Pack (100mg) to rank 5 contrasts with the 65% decline in Oh.Hi Lubricant (115.81mg THC, 15ml) to rank 8 and a modest $409 in sales for the surging Watermelon Gummies 2-Pack (20mg), implying trial-size momentum but limited revenue leverage. The pattern suggests a pivot point where multi-pack flagship gummies still anchor share by rank despite double-digit declines, while smaller trial formats are the growth entry that may need trade-up paths to sustain mix value.
Top Selling Cannabis Brands






Data for this report comes from real-time sales reporting by participating cannabis retailers via their point-of-sale systems, which are linked up with Headset’s business intelligence software. Headset’s data is very reliable, as it comes digitally direct from our partner retailers. However, the potential does exist for misreporting in the instance of duplicates, incorrectly classified products, inaccurate entry of products into point-of-sale systems, or even simple human error at the point of purchase. Thus, there is a slight margin of error to consider. Brands listed on this page are ranked in the top twenty within the market and product category by total retail sales volume.

