Jun-2026
Sales
Trend
6-Month
Product Count
SKUs
Avg Price
YoY Sales Change
YoY Price Change
Market Insights Snapshot
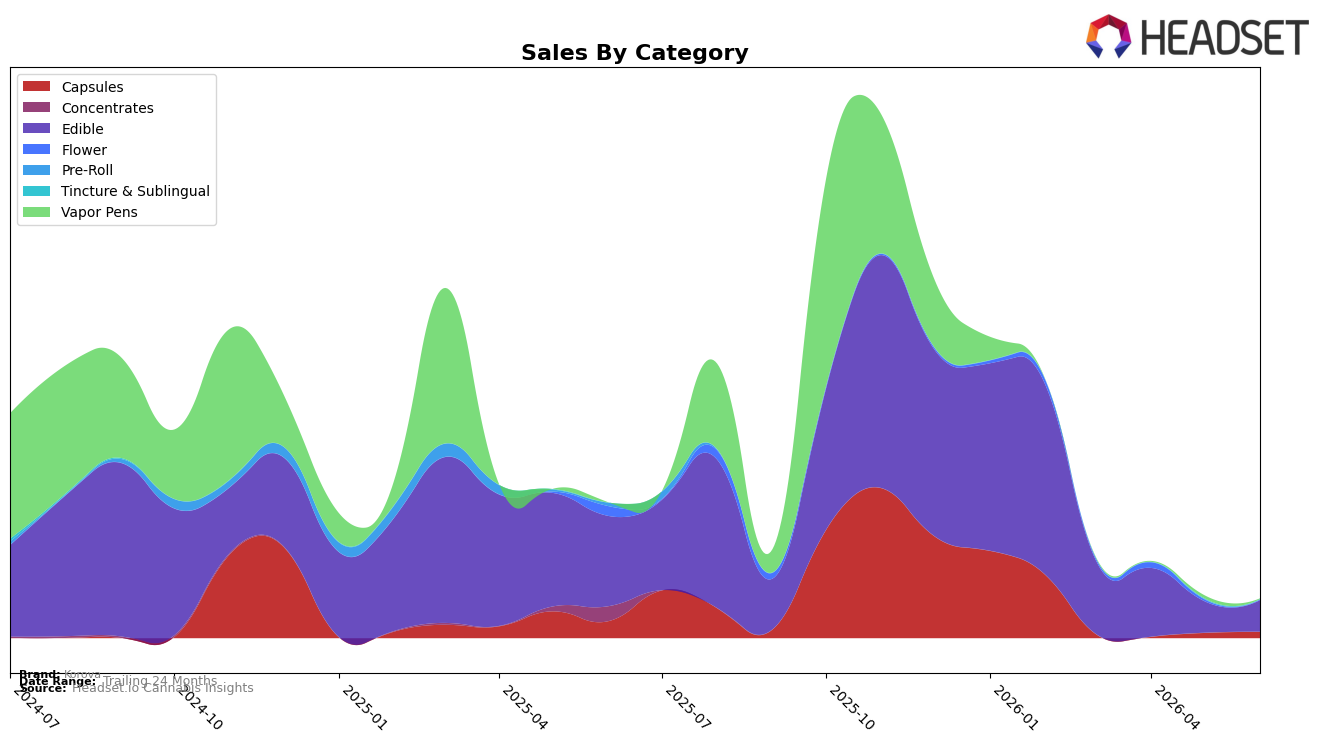
Korova concentrated 81.79% of June 2026 sales in Edible, up 0.41% month over month but down 65.24% year over year, while Capsules held 15.89% share with a 20.33% month-over-month lift and a 63.73% year-over-year decline; Vapor Pens slipped to 1.46% share with an 80.49% month-over-month drop, and Flower fell to 0.87% share with an 80.60% month-over-month decline and a 96.52% year-over-year contraction. With the average price down 26.09% year over year to $19.19 and Edible average price at $17.35 versus Capsules at $38.25, the mix implies a pivot toward lower-priced volume in Edible while Capsules acts as a smaller, higher-ticket buffer; the thesis is that Korova is consolidating around Edible breadth while de-prioritizing inhalables that are shrinking rapidly.
The mix shift—Edible’s 81.79% share paired with Capsules’ 15.89% and steep month-over-month declines of 80.49% in Vapor Pens and 80.60% in Flower—positions Korova as an Edible-led brand with a secondary therapeutic or function-forward angle via Capsules. Given a 71.49% brand-level year-over-year sales contraction and a 93.10% 24-month decline alongside a 0.41% month-over-month uptick in Edible and a 20.33% month-over-month gain in Capsules, the implication is defensive concentration: prioritize Edible velocity in Arizona with selective retention of higher-price Capsules to stabilize revenue density, while pulling back from volatile inhalable formats where price and share erosion outweigh contribution.
Competitive Landscape
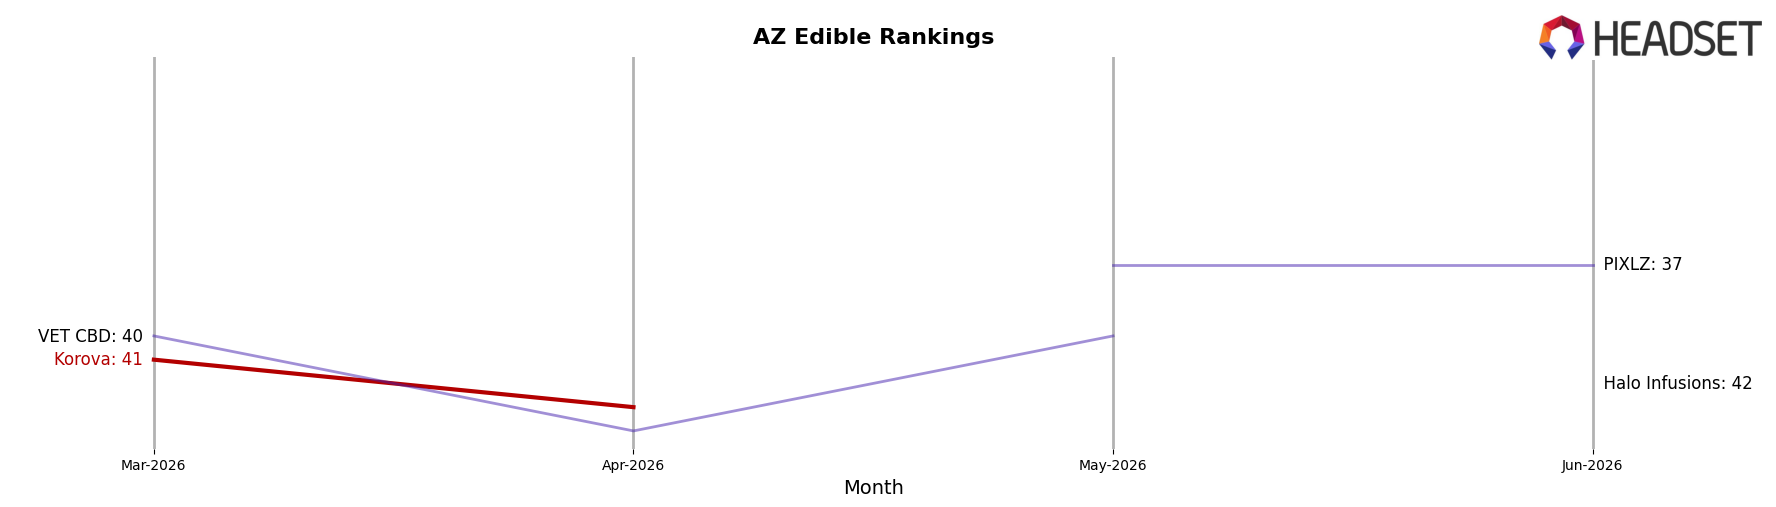
Korova sits at rank #48 in AZ Edible in June 2026, down 7 positions from #41 in March 2026, while category leaders moved in the opposite direction: Wyld held #1 with a year-over-year sales change of -15.3% but no rank loss (staying #1 to #1), and Baked Bros climbed from #4 to #3 alongside a 30.9% year-over-year sales increase. Korova’s peak at #41 in March 2026 and current position at #48 in June 2026 indicate a 7-rank slide over one quarter as competitors like Wana edged up from #6 to #5 with a 10.8% year-over-year gain; this path implies Korova is losing relative velocity in a tier where modest upward moves by rivals are enough to displace brands lacking recent rank momentum.
Notable Products
Strawberry Twerpz Rope Gummy (100mg) posted the steepest decline in June 2026 at -39% MoM while holding rank 2, and Biggie Cookie 10-Pack (1000mg) fell -27% MoM at rank 4, together signaling a demand pullback in two flagship formats despite Hybrid Fruit Punch Twerpz Rope Gummy (100mg) staying at rank 1 with only a -1.7% MoM dip. In contrast, Geltab 10-Pack (1000mg) rose +20% MoM at rank 6 and Black Bar Brownie (100mg) climbed +42% MoM at rank 8, indicating momentum outside the Twerpz rope gummies where Peach and Grape variants slipped -7.1% and -1.0% MoM at ranks 5 and 7. With eight of the top ten SKUs in Edibles, the mix concentrates around confections while a single Capsules entry contributes a material share at $1,564, suggesting Korova is tilting from novelty ropes toward higher-dosage formats and classic baked goods to stabilize volume and margins.
Top Selling Cannabis Brands
Data for this report comes from real-time sales reporting by participating cannabis retailers via their point-of-sale systems, which are linked up with Headset’s business intelligence software. Headset’s data is very reliable, as it comes digitally direct from our partner retailers. However, the potential does exist for misreporting in the instance of duplicates, incorrectly classified products, inaccurate entry of products into point-of-sale systems, or even simple human error at the point of purchase. Thus, there is a slight margin of error to consider. Brands listed on this page are ranked in the top twenty within the market and product category by total retail sales volume.

