Jun-2026
Sales
Trend
6-Month
Product Count
SKUs
Avg Price
YoY Sales Change
YoY Price Change
Market Insights Snapshot
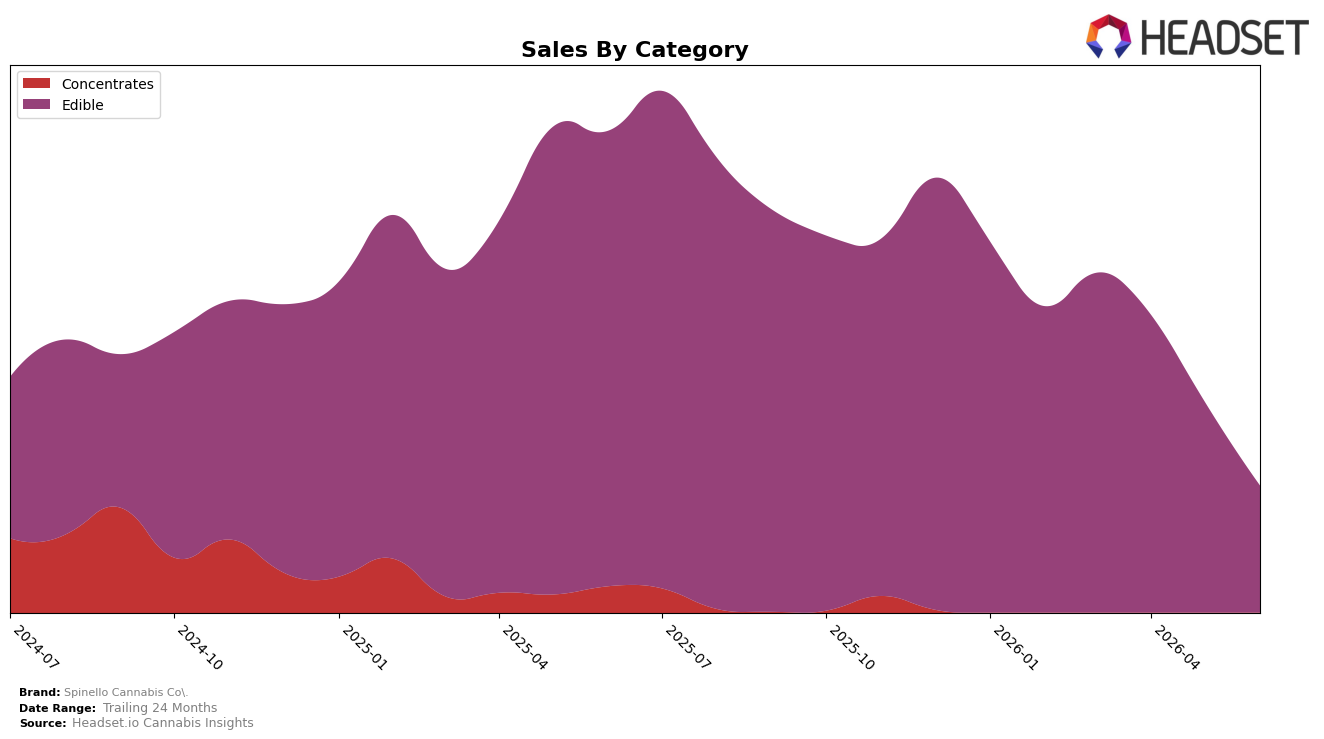
Spinello Cannabis Co. concentrated entirely in Edible during June 2026, with category share at 100.0% and an average price of $12.32. Within Edible, year-over-year sales fell 72.19% while month-over-month declined 39.90%, and overall brand sales were down 73.71% YoY alongside a modest 0.53% YoY lift in average price; this mix shift implies the brand has no diversification buffer. With Edible holding the top-category position yet anchoring a 24th rank in Colorado Edible, the pattern points to volume contraction outpacing price adjustments, suggesting reliance on a single category is amplifying volatility.
The compression in Edible, marked by a 39.90% MoM drop and a 72.19% YoY decline while holding rank 24 in Colorado, implies Spinello Cannabis Co. is positioned as a lower-velocity, niche participant rather than a scale player in the segment. Coupled with a 0.53% YoY rise in average price and a 30.62% decline over 24 months at the brand level, the trajectory indicates pricing is not the primary lever; instead, assortment breadth and distribution depth within Edible likely cap share gains, signaling the current positioning prioritizes a narrow footprint over rank advancement.
Competitive Landscape
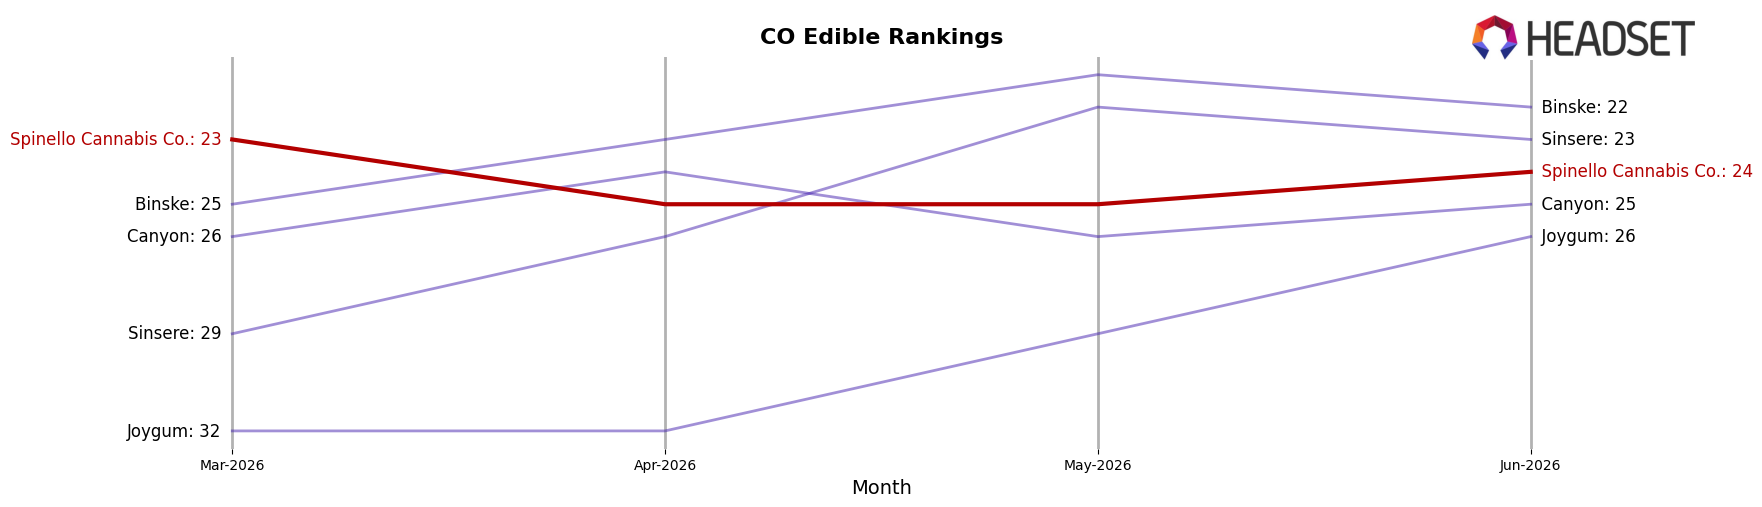
Spinello Cannabis Co. sits at rank #24 in CO Edible for June 2026, sliding 2 positions from #22 year over year and down 1 position from #23 in March 2026, while remaining 3 spots below its peak of #21 from August 2025; in contrast, Wyld held #1 with a -16.6% YoY sales change and Wana stayed at #2 with a -0.5% YoY shift, indicating top-tier stability even amid declines. The combination of a 2-position YoY drop and a 1-position slide over the last quarter, alongside competitors like Dialed In Gummies remaining at #3 with +3.7% YoY growth, implies Spinello Cannabis Co.’s rank trajectory is drifting toward the middle tier unless assortment or pricing adjustments recapture share.
Notable Products
Sativa Mango Rosin Chews 10-Pack (100mg) posted the steepest decline in June 2026, down 83.37% MoM to rank 3, while Blueberry Rosin Gummies 10-Pack (100mg) fell 13.76% MoM at rank 2. Peach Rosin Gummies 10-Pack (100mg) slid 106.12% MoM yet still held rank 1 on minimal dollars, indicating price or returns noise more than demand stability. With four of the top ten being Mango variants and five being Peach variants, concentrated flavor exposure coincides with double-digit drops like -29.35% and -23.95% across adjacent SKUs, implying flavor clustering is amplifying cannibalization risk rather than broadening reach.
Top Selling Cannabis Brands
Data for this report comes from real-time sales reporting by participating cannabis retailers via their point-of-sale systems, which are linked up with Headset’s business intelligence software. Headset’s data is very reliable, as it comes digitally direct from our partner retailers. However, the potential does exist for misreporting in the instance of duplicates, incorrectly classified products, inaccurate entry of products into point-of-sale systems, or even simple human error at the point of purchase. Thus, there is a slight margin of error to consider. Brands listed on this page are ranked in the top twenty within the market and product category by total retail sales volume.

