Market Insights Snapshot
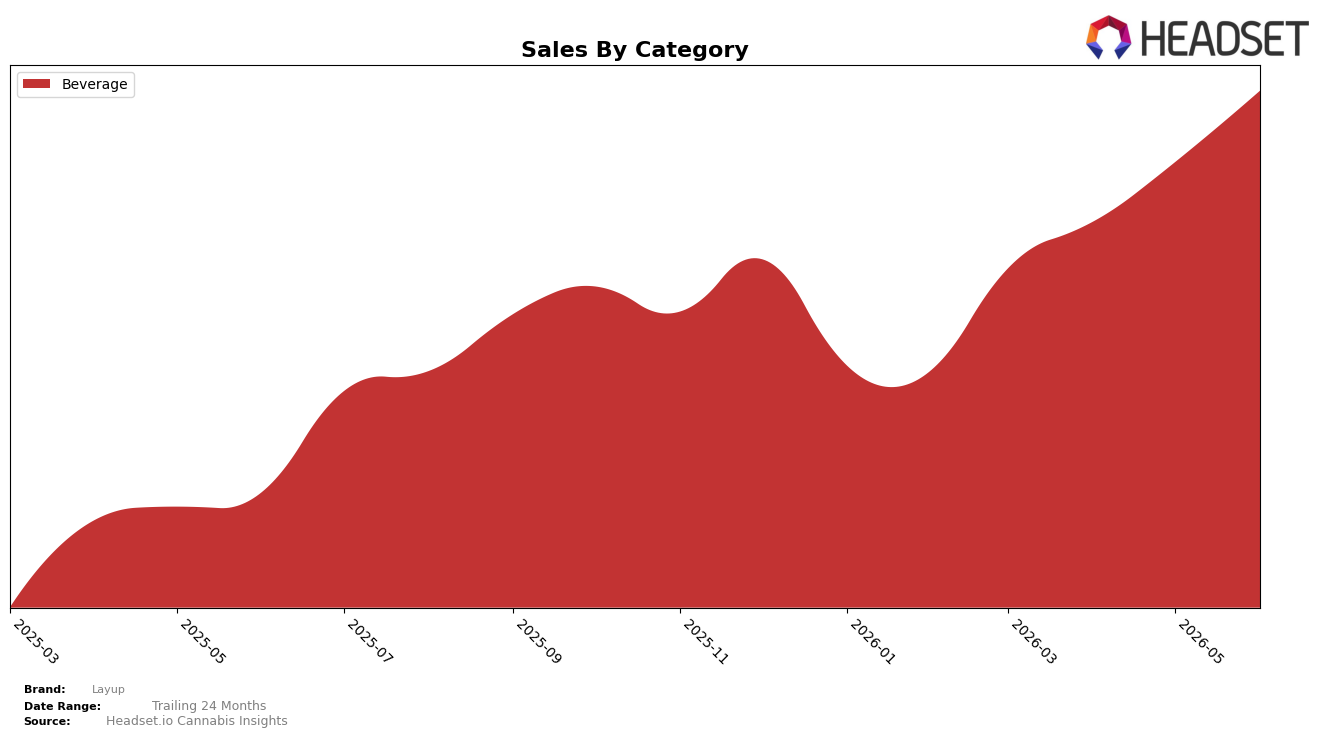
In June 2026, Layup’s mix concentrated 100.0% in Beverage, pairing a 323.27% year-over-year surge with a 15.69% month-over-month lift, while average price fell 17.67% YoY to $4.68. With rank 2 in Beverage in New York and a single-category footprint, the pattern implies deliberate depth over breadth: velocity is accelerating on a narrower base as unit expansion outpaces price.
The combination of a 15.69% MoM gain alongside a rank position of 2 in New York suggests Layup is leaning into volume-led share capture rather than premiumization, as evidenced by a 17.67% YoY price decline coexisting with 323.27% YoY sales growth. This setup implies the brand’s positioning is shifting toward scale leadership in Beverage, where sustained unit growth at a lower price point can reinforce rank stability and create headroom for selective pricing tests without sacrificing momentum.
Competitive Landscape
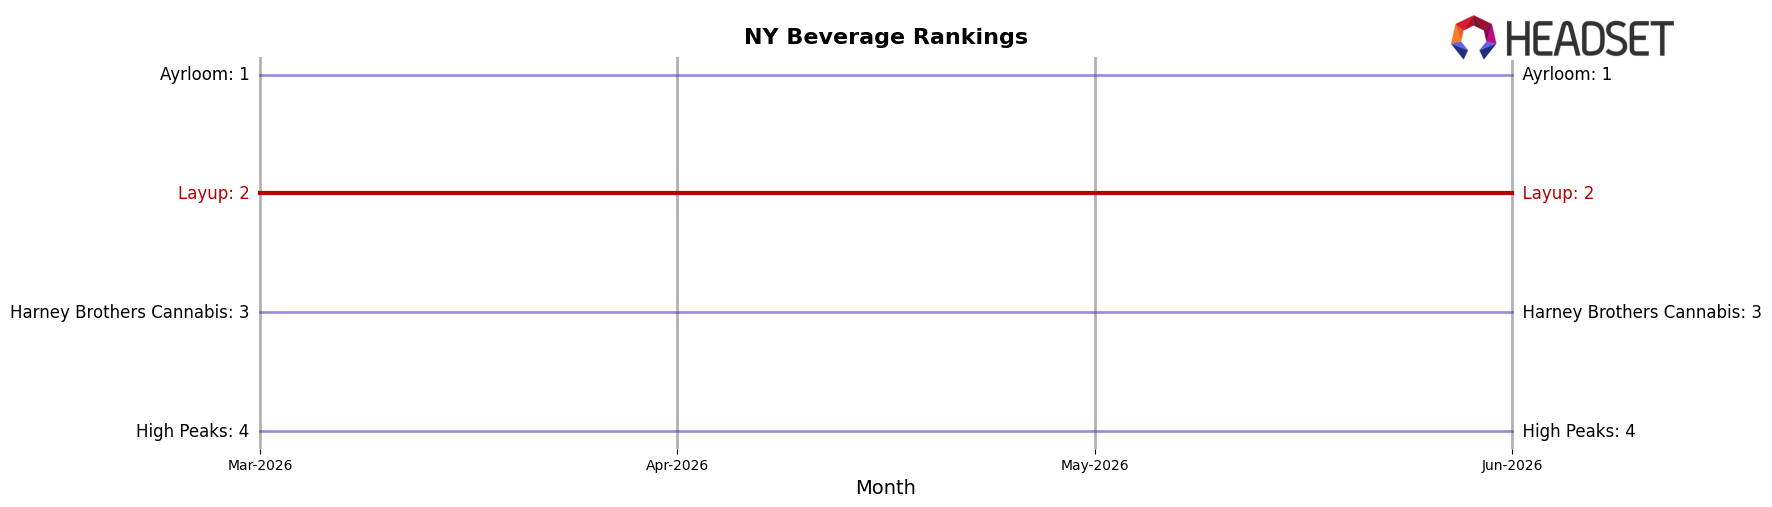
Layup sits at rank #2 in NY Beverage in June 2026, improving 1 position from #3 year over year, while holding flat versus three months ago at #2; by contrast, Ayrloom remained at #1 year over year and Harney Brothers Cannabis climbed from #7 to #3 with a 310.83% YoY sales increase. The gap pressure is mixed: High Peaks stayed at #4 despite 67.23% YoY growth, while Tune fell from #2 to #5 as sales declined 29.46% YoY, indicating Layup’s elevation to #2 is more about outpacing a declining peer than overtaking the long-time leader. The pattern implies Layup’s current ceiling is constrained by Ayrloom’s #1 hold and the accelerating ascent of Harney Brothers Cannabis, so maintaining #2 will require offsetting fast followers more than chasing the incumbent.
Notable Products
Strawberry Lemonade (10mg THC, 12oz, 355ml) posted the largest move in June 2026 with a 109.6% month-over-month surge to rank 3, while Playoff Punch Lemonnade (10mg THC, 12oz, 355ml) fell 36.4% to rank 4, and the second Raspberry Tea variant slid 16.4% at rank 10. Black Cherry Lemonade (10mg THC, 12oz, 355ml) also accelerated 91.5% to rank 2, as Limeade Lemonade (10mg THC, 12oz, 355ml) held rank 1 with 31.1% growth and $79,977 in sales. With all top-10 SKUs in Beverages and three lemonades occupying ranks 1–3, the mix implies Layup is consolidating volume around citrus-led refreshers while pruning or repositioning lagging flavors.
Top Selling Cannabis Brands
Data for this report comes from real-time sales reporting by participating cannabis retailers via their point-of-sale systems, which are linked up with Headset’s business intelligence software. Headset’s data is very reliable, as it comes digitally direct from our partner retailers. However, the potential does exist for misreporting in the instance of duplicates, incorrectly classified products, inaccurate entry of products into point-of-sale systems, or even simple human error at the point of purchase. Thus, there is a slight margin of error to consider. Brands listed on this page are ranked in the top twenty within the market and product category by total retail sales volume.

