Jun-2026
Sales
Trend
6-Month
Product Count
SKUs
Avg Price
YoY Sales Change
YoY Price Change
Market Insights Snapshot
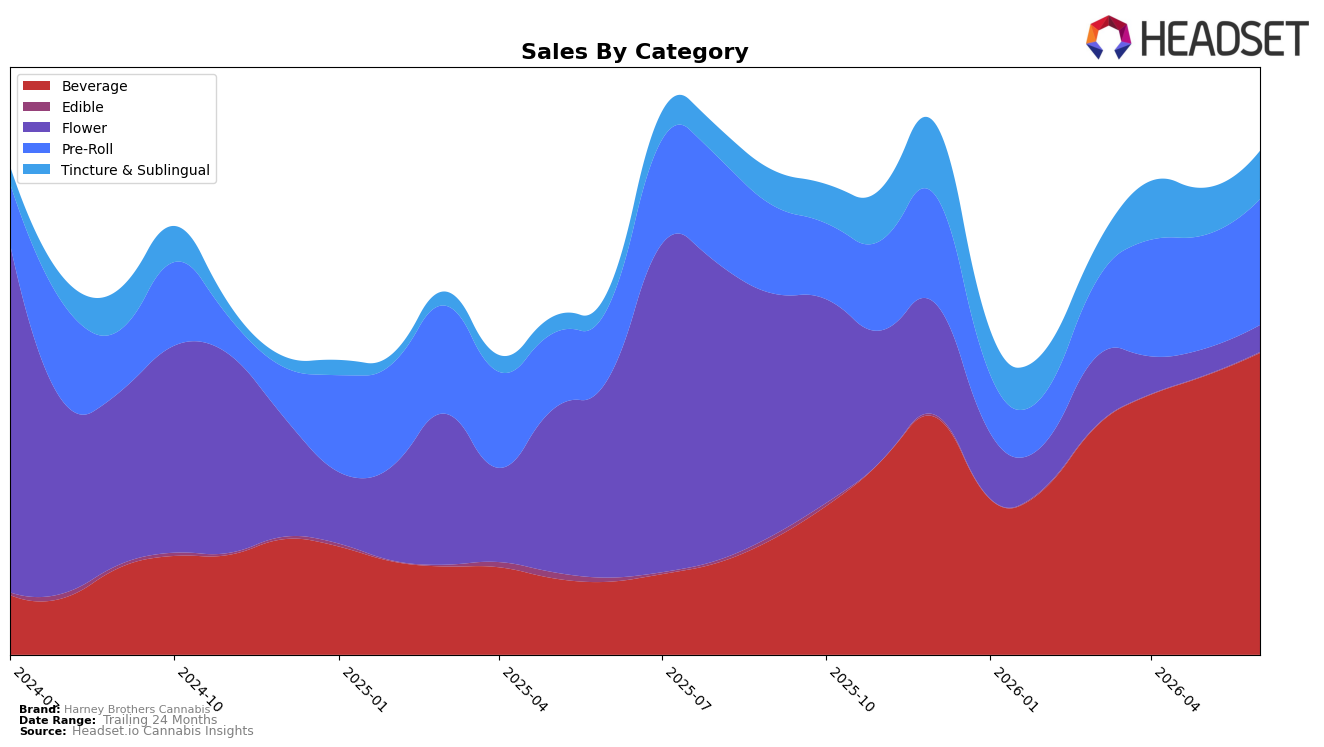
In June 2026, Beverage expanded to a 59.67% share with 310.83% year-over-year growth and 8.25% month-over-month, while Pre-Roll held 24.92% share with 74.86% YoY and 10.58% MoM. Tincture & Sublingual reached 9.68% share on 184.76% YoY and 2.45% MoM, as Flower contracted to 5.44% share with -86.20% YoY and 1.23% MoM; Edible remained marginal at 0.30% share despite -68.00% YoY and a 22.18% MoM uptick. With Beverage ranked 3 in New York for its category and average price down 59.89% YoY to $8.09, the mix signals a pivot toward volume-led Beverage and Pre-Roll sell-through while legacy Flower retrenches.
The shift concentrates Harney Brothers Cannabis’s positioning around value-accessible formats: Beverage pricing at $5.91 average and 310.83% YoY growth indicates scale that can anchor traffic, while Pre-Roll’s 24.92% mix and 10.58% MoM suggest attachment and repeat. Tincture & Sublingual’s 184.76% YoY on a 9.68% share adds premium margin balance as Flower’s -86.20% YoY and 5.44% share reduce exposure to commodity volatility; the result is a barbell between high-velocity Beverage and steady Pre-Roll, with targeted specialty uplift from Tincture & Sublingual, implying the brand can defend its June 2026 category rank position by leaning into Beverage-led basket building in New York.
Competitive Landscape
Harney Brothers Cannabis sits at rank #3 in NY Beverage for June 2026, up 4 positions year over year from #7, while holding flat versus March 2026 at #3; in contrast, Ayrloom stayed #1 year over year with a 60.2% YoY sales increase, and Layup moved from #3 to #2 alongside a 319.4% YoY sales jump. With Tune sliding from #2 to #5 on a 29.5% YoY decline and High Peaks holding #4 with 67.2% YoY growth, Harney Brothers Cannabis reaching its peak rank of #3 in June 2026 implies share is consolidating at the top, and maintaining or converting from #3 will require outpacing competitors whose rank gains are paired with triple-digit growth.

Notable Products
Harney Brothers Cannabis CBD/THC 1:1 White Peach Matcha Tea (10mg CBD, 10mg THC) posted the sharpest move in June 2026 with a 33.6% month-over-month gain to rank 6, while CBD/THC 1:1 Peach Black Tea (10mg CBD, 10mg THC, 16oz) climbed 30.0% to rank 2. At the top, CBD/THC 1:1 Hibiscus Herbal Tea (10mg CBD, 10mg THC, 16oz) held rank 1 with a 14.0% lift, and the category bench shows concentration with eight of the top ten as Beverage SKUs. This pattern implies the brand is consolidating share around 1:1 beverage formats even as it cultivates a premium tier within flavored teas.
Outside beverages, Sour Diesel Pre-Roll (1g) jumped 29.8% to rank 5, while the only material slip came from CBD/THC 1:1 Orange Mango Juice Drink (10mg CBD, 10mg THC, 16oz) at -2.3% and rank 9. The absence of a recorded month-over-month rate for Acapulco Gold Pre-Roll (1g) at rank 10 alongside $40,034 for Sour Diesel Pre-Roll (1g) points to momentum skewed toward a single pre-roll hero rather than a broad pre-roll lineup. The mix implies near-term revenue leverage from beverage-led growth with selective bets in pre-rolls to diversify basket entry points without diluting the beverage core.
Top Selling Cannabis Brands
Data for this report comes from real-time sales reporting by participating cannabis retailers via their point-of-sale systems, which are linked up with Headset’s business intelligence software. Headset’s data is very reliable, as it comes digitally direct from our partner retailers. However, the potential does exist for misreporting in the instance of duplicates, incorrectly classified products, inaccurate entry of products into point-of-sale systems, or even simple human error at the point of purchase. Thus, there is a slight margin of error to consider. Brands listed on this page are ranked in the top twenty within the market and product category by total retail sales volume.

