Market Insights Snapshot
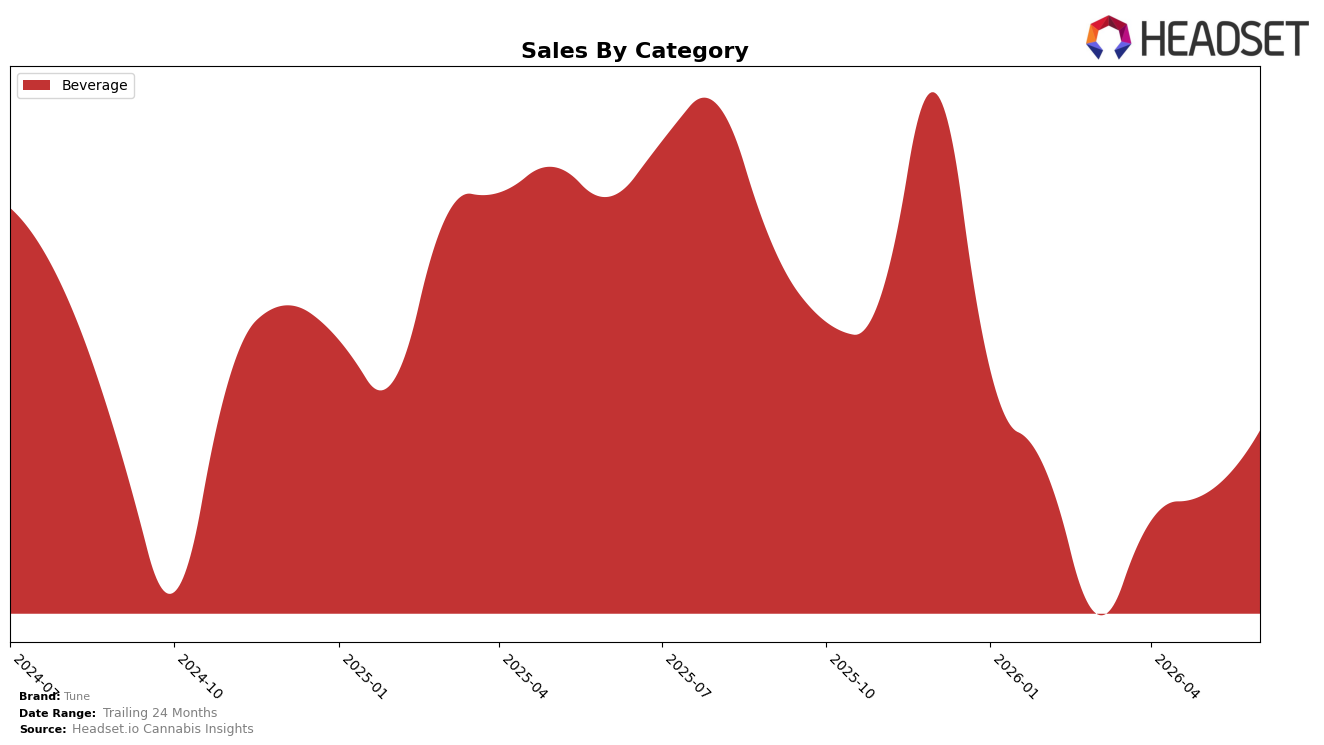
Tune concentrated 100.0% of June 2026 sales in Beverage, with category sales up 12.85% month over month but down 29.46% year over year, while average price rose 102.55% YoY to $13.11. Within New York Beverage, Tune held rank 5, indicating share stability MoM despite the YoY contraction; the juxtaposition of a 12.85% MoM lift and a 29.46% YoY decline implies price-led recovery is offsetting volume pressure, not expanding the category footprint.
The mix being 100.0% Beverage and a price jump of 102.55% YoY alongside a 29.46% YoY sales decline suggests Tune’s positioning is skewing toward higher-ticket, narrower throughput rather than elastic, volume-accretive offerings. Holding rank 5 in New York while posting a 12.85% MoM sales rise indicates near-term competitive parity is maintained through pricing and pack strategy, but the YoY gap signals that sustained share gains will likely require volume recapture within Beverage rather than further price escalation.
Competitive Landscape
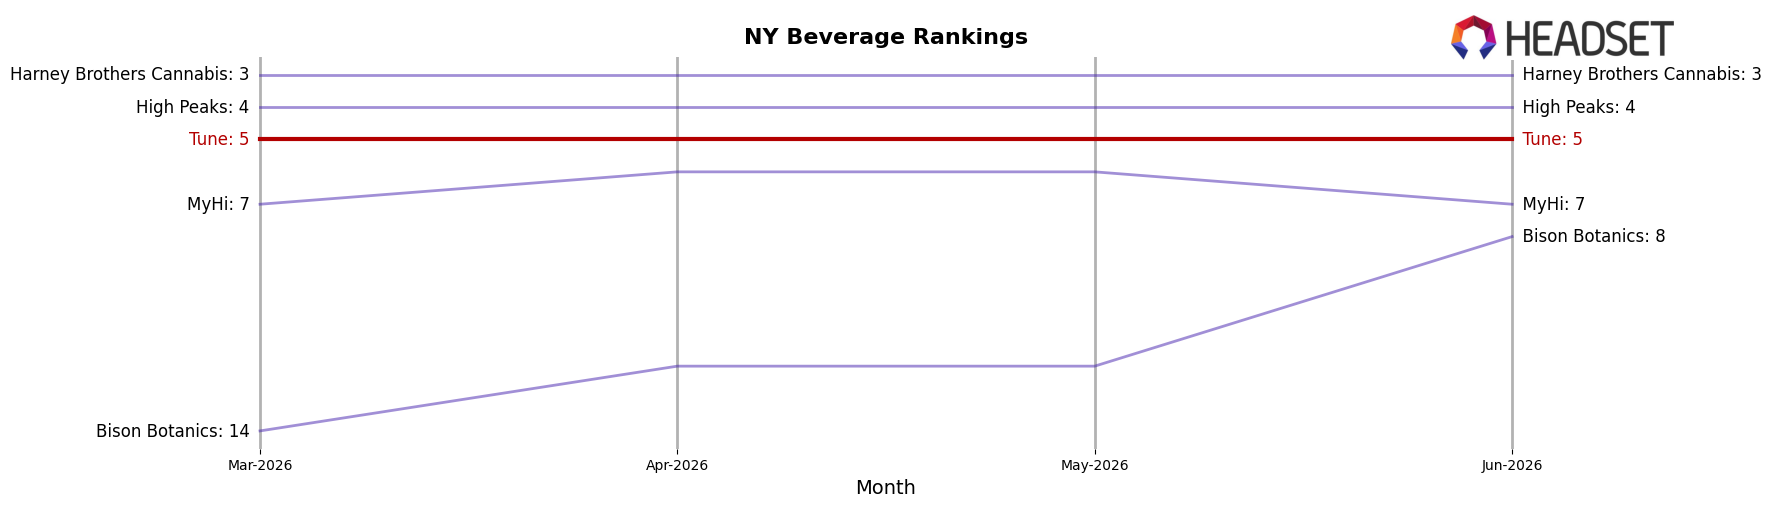
Tune sits at #5 in NY Beverage in June 2026, a 3-place decline from its peak at #2 in June 2025 and flat versus #5 three months ago, while the year-over-year rank change is +2 from #7, indicating upward movement despite mid-year stagnation; by comparison, Ayrloom held #1 year-over-year and remains #1 now, and Layup advanced from #3 year-over-year to #2, signaling that Tune’s recovery to #5 alongside competitor gains at #1 and #2 implies a consolidation phase where incremental share wins must come from displacing High Peaks at #4 or countering triple-digit growth leaders.
Notable Products
Sicilian Lemon & Rose Infused Seltzer (10mg THC, 12oz) posted the steepest decline in June 2026 at -58.6% and slid to rank 7, while its 4-Pack counterpart fell -45.5% at rank 8, indicating a sharp retreat in the lemon-rose line. In contrast, Raspberry Lime Infused Seltzer 4-Pack (40mg, 12oz, 355ml) climbed 41.6% to rank 1 and Black Cherry Infused Seltzer 4-Pack (40mg, 12oz, 355ml) rose 41.9% to rank 2, concentrating momentum in multipack 40mg formats. With all top-10 slots in Beverage and three 4-Pack SKUs occupying ranks 1-3 alongside single-serve 10mg variants dropping between -9.1% and -27.4%, the pattern implies a consumer shift toward higher-dose multipacks at the expense of single-serve cans, steering Tune’s mix toward bundle-led value despite only $26,255 on the leading SKU.
Top Selling Cannabis Brands
Data for this report comes from real-time sales reporting by participating cannabis retailers via their point-of-sale systems, which are linked up with Headset’s business intelligence software. Headset’s data is very reliable, as it comes digitally direct from our partner retailers. However, the potential does exist for misreporting in the instance of duplicates, incorrectly classified products, inaccurate entry of products into point-of-sale systems, or even simple human error at the point of purchase. Thus, there is a slight margin of error to consider. Brands listed on this page are ranked in the top twenty within the market and product category by total retail sales volume.

