.svg)


Where to Buy
Leal is stocked at 140 licensed dispensaries across New York and Michigan, 138 of them in New York, with the deepest coverage in New York, Queens, Brooklyn, Buffalo, and Staten Island. Search by ZIP code or city below to find the closest one, or filter by product type if you are after a specific format.
Market Insights Snapshot
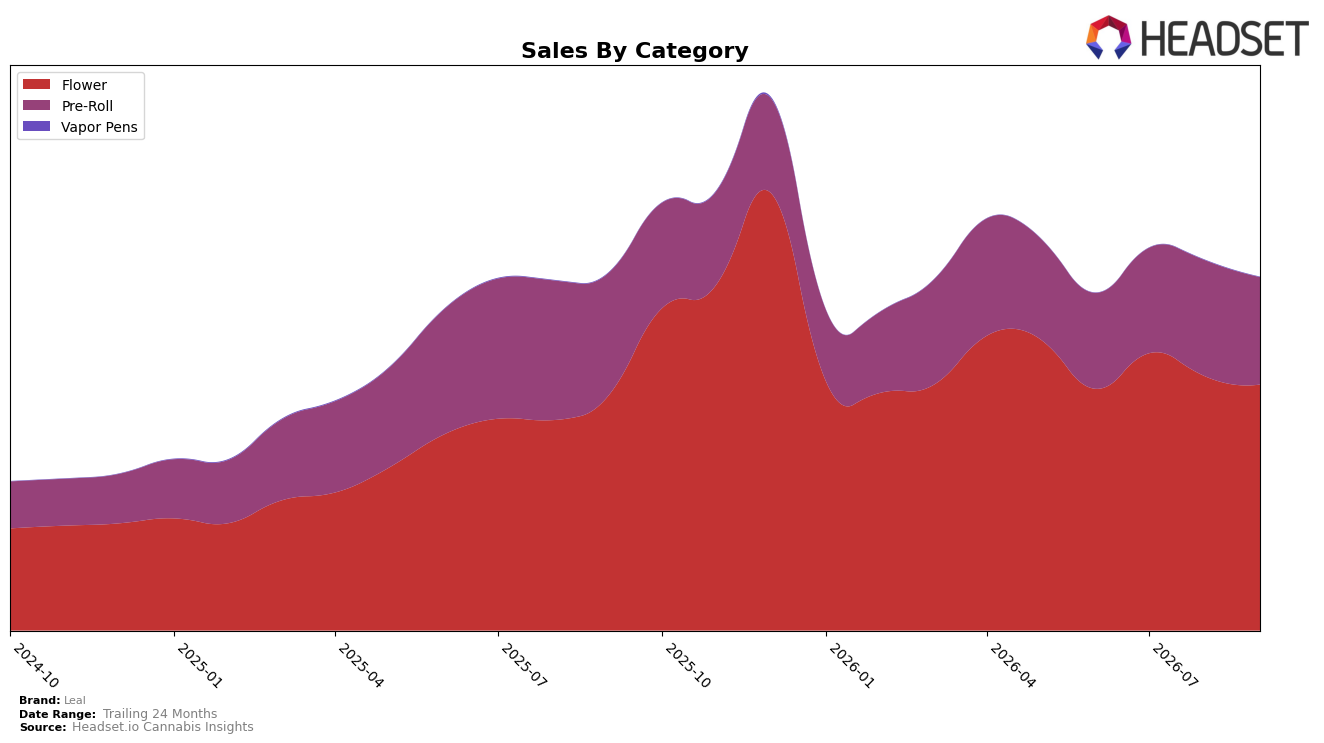
In September 2026, Leal’s category mix concentrated further into Flower at 69.63% share, with Flower up 4.86% year over year but down 3.31% month over month, while Pre-Roll held 30.34% share with a 12.53% YoY decline and a 7.44% MoM drop. Vapor Pens fell to 0.03% share with a 57.61% YoY contraction and a 38.78% MoM step-down, pairing with a brand-level YoY sales change of -1.15% and a 1.49% YoY increase in average price to signal a mix shift toward higher-priced Flower. Leal’s Flower placement at rank 4 in New York alongside a 3.31% MoM Flower dip and 7.44% MoM Pre-Roll dip implies reliance on Flower scale to offset soft Pre-Roll velocity, concentrating risk in a single lead category.
The mix and rank suggest Leal’s positioning is anchored in premiumized Flower—supported by a 1.49% YoY average price lift and a 4.86% YoY Flower gain—while under-participation in Pre-Roll and Vapor Pens, with 12.53% and 57.61% YoY declines respectively, reduces cross-category capture. With Flower share at 69.63% versus Pre-Roll at 30.34% and Vapor Pens at 0.03%, and with MoM declines of 3.31% in Flower and 7.44% in Pre-Roll, the portfolio skews toward fewer, higher-priced Flower units rather than unit-heavy value formats; this implies near-term stability tied to maintaining rank 4 in New York Flower but exposes the brand to downside if Flower momentum softens further or price elasticity rises.
Competitive Landscape
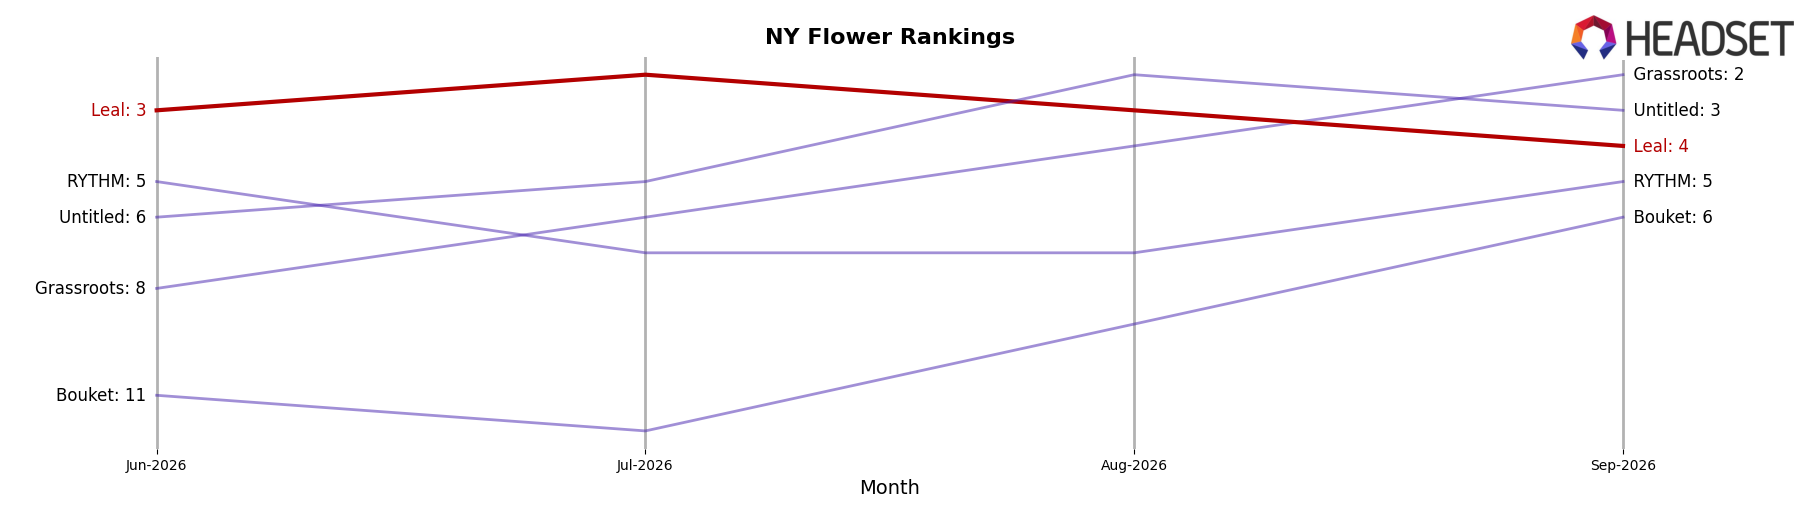
Leal is currently ranked #4 in NY Flower, improving 2 positions year over year from #6 and slipping 1 spot since June–August’s #3 position, while peaking at #2 in July 2026; in contrast, Find. climbed from #5 to #1 and Grassroots surged from #15 to #2 with a 150.3% YoY sales increase, and Untitled advanced from #9 to #3 alongside RYTHM moving from #8 to #5 with a 20.3% YoY lift; this mix of Leal’s July 2026 peak at #2 followed by a September 2026 position at #4 implies momentum that is present but being outpaced by faster-climbing rivals, signaling a need to defend against share displacement at the top tier.
Notable Products
Hella Jelly Pre-Roll (1g) posted the steepest movement in September 2026 with a -40.9% MoM drop and fell to rank 8, while Lemon Venom Pre-Roll (1g) also slid -39.5% at rank 10; by contrast, Super Boof Pre-Roll (1g) rose +29.5% to rank 3, indicating volatility concentrated at the lower end of the top ten. Thin Mint GSC Pre-Roll (1g) held rank 1 with +19.7% MoM, and Garlic Budder Pre-Roll (1g) declined -19.1% at rank 4, with Animal Face Pre-Roll (1g) down -12.3% at rank 6; eight of the top ten are Pre-Roll SKUs, concentrating exposure in a single format. Platinum Lemon Cherry Gelato (3.5g) entered the list at rank 9 with $107,149 in sales and no MoM baseline, contrasting with Chronic Tonic Pre-Roll (1g) at rank 2 with no MoM data available. The pattern implies Leal’s commercial direction is overly weighted to Pre-Rolls, where sharp month-to-month swings can whipsaw share unless the lineup broadens into Flower to balance risk.
Top Selling Cannabis Brands






Data for this report comes from real-time sales reporting by participating cannabis retailers via their point-of-sale systems, which are linked up with Headset’s business intelligence software. Headset’s data is very reliable, as it comes digitally direct from our partner retailers. However, the potential does exist for misreporting in the instance of duplicates, incorrectly classified products, inaccurate entry of products into point-of-sale systems, or even simple human error at the point of purchase. Thus, there is a slight margin of error to consider. Brands listed on this page are ranked in the top twenty within the market and product category by total retail sales volume.

