Jun-2026
Sales
Trend
6-Month
Product Count
SKUs
Avg Price
YoY Sales Change
YoY Price Change
Market Insights Snapshot
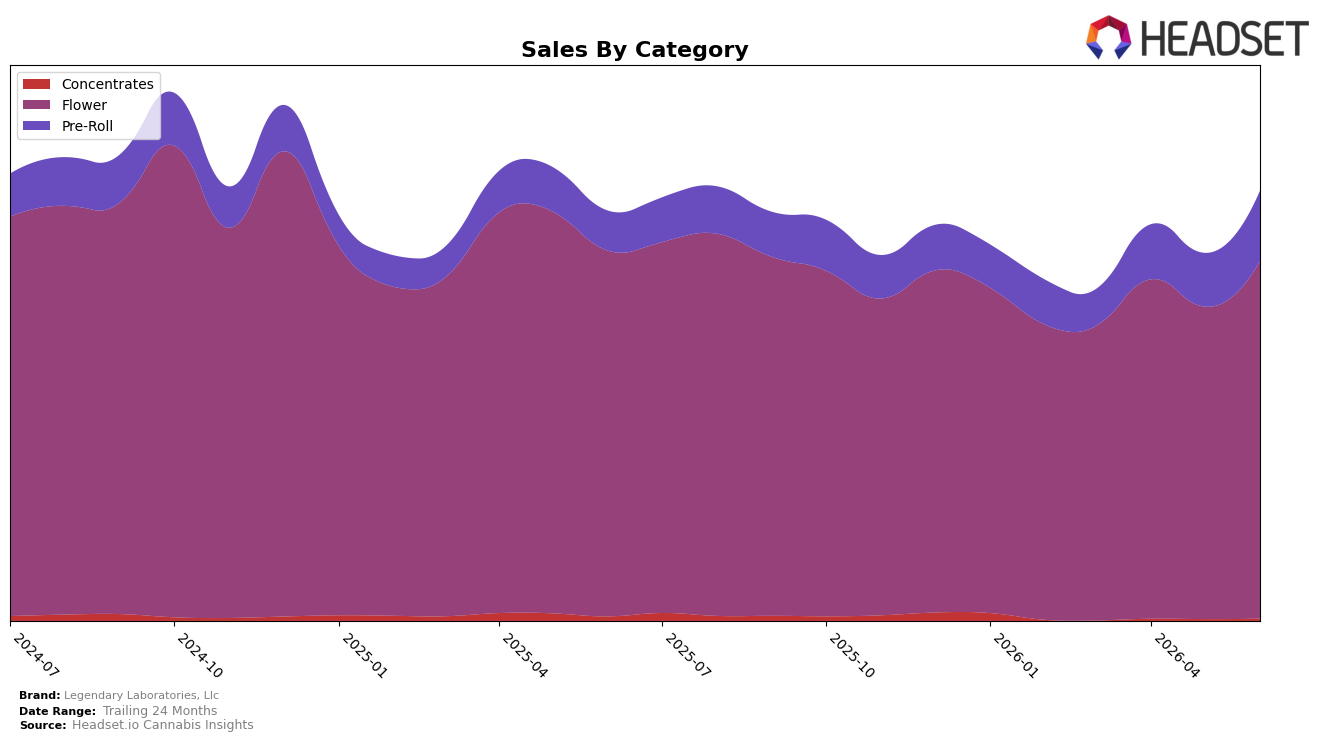
Legendary Laboratories, Llc concentrated 83.16% of June 2026 sales in Flower, ranked 21st in Flower in Washington, while Pre-Roll accounted for 16.32%. Within June 2026, Flower rose 14.49% month over month despite a -2.16% year over year decline, and Pre-Roll expanded 30.69% MoM alongside a 75.47% YoY gain; Concentrates, at 0.53% share, climbed 24.25% MoM after a -50.15% YoY drop. With brand-level sales up 4.88% year over year and average price down 18.93%, the mix shift toward faster-growing, lower-priced formats implies volume-led growth is offsetting price compression and nudging reliance away from a single-category anchor.
The combination of a dominant Flower base at 83.16% share and accelerating Pre-Roll growth at 30.69% MoM and 75.47% YoY suggests the brand is repositioning toward value-accessible entry points while maintaining a foothold in a higher-ticket segment. Holding 21st rank in Flower in Washington alongside a 14.49% MoM Flower lift, while Concentrates remain at 0.53% share with a -50.15% YoY, points to a barbell approach: defend relevance in the core while leaning into a faster-churning Pre-Roll channel. The pattern implies pricing power is constrained but distribution and SKU breadth in Pre-Rolls are likely improving, positioning the brand to trade volume for share gains and reduce exposure to Flower volatility.
Competitive Landscape
Legendary Laboratories, Llc sits at rank #21 in WA Flower for June 2026 with a 0-position year-over-year rank change from #21, while improving 5 spots versus three months ago (from #26 to #21); by contrast, Phat Panda held #1 both year-over-year and currently with sales up 16.6%, and Lifted Cannabis Co climbed from #8 to #3 with sales up 17.9%. Despite a prior peak at #15 in December 2024, the flat YoY rank at #21 alongside a near-term 5-rank climb suggests stabilization rather than share expansion, implying that regaining mid-teen territory will require outpacing top-tier risers rather than merely holding position.

Notable Products
La Runtz Pre-Roll 2-Pack (1g) posted the largest movement in June 2026 with a 104.9% month-over-month surge and climbed into rank 7, while LA Runtz (3.5g) in Flower jumped 63.2% to rank 6. In contrast, Bubblegum Gelato (3.5g) fell 36.5% to rank 8, and Bubblegum Gelato Pre-Roll 2-Pack (1g) slipped 4.1% but held rank 4. Four of the top ten are Flower SKUs and four are Pre-Roll SKUs, indicating a split portfolio where outsized gains in value-priced multipack Pre-Rolls are offsetting softness in a legacy Gelato Flower SKU; the pattern implies a shift toward accelerating Pre-Roll velocity to drive incremental share while defending core Flower positions.
Top Selling Cannabis Brands
Data for this report comes from real-time sales reporting by participating cannabis retailers via their point-of-sale systems, which are linked up with Headset’s business intelligence software. Headset’s data is very reliable, as it comes digitally direct from our partner retailers. However, the potential does exist for misreporting in the instance of duplicates, incorrectly classified products, inaccurate entry of products into point-of-sale systems, or even simple human error at the point of purchase. Thus, there is a slight margin of error to consider. Brands listed on this page are ranked in the top twenty within the market and product category by total retail sales volume.

