.svg)

Sep-2026
Sales
Trend
6-Month
Product Count
SKUs
Avg Price
YoY Sales Change
YoY Price Change


Where to Buy
High Tide Cannabis Company (WA) is stocked at 46 licensed dispensaries across Washington, with the deepest coverage in Tacoma, Seattle, Lynnwood, Bremerton, and Everett. Search by ZIP code or city below to find the closest one, or filter by product type if you are after a specific format.
Market Insights Snapshot
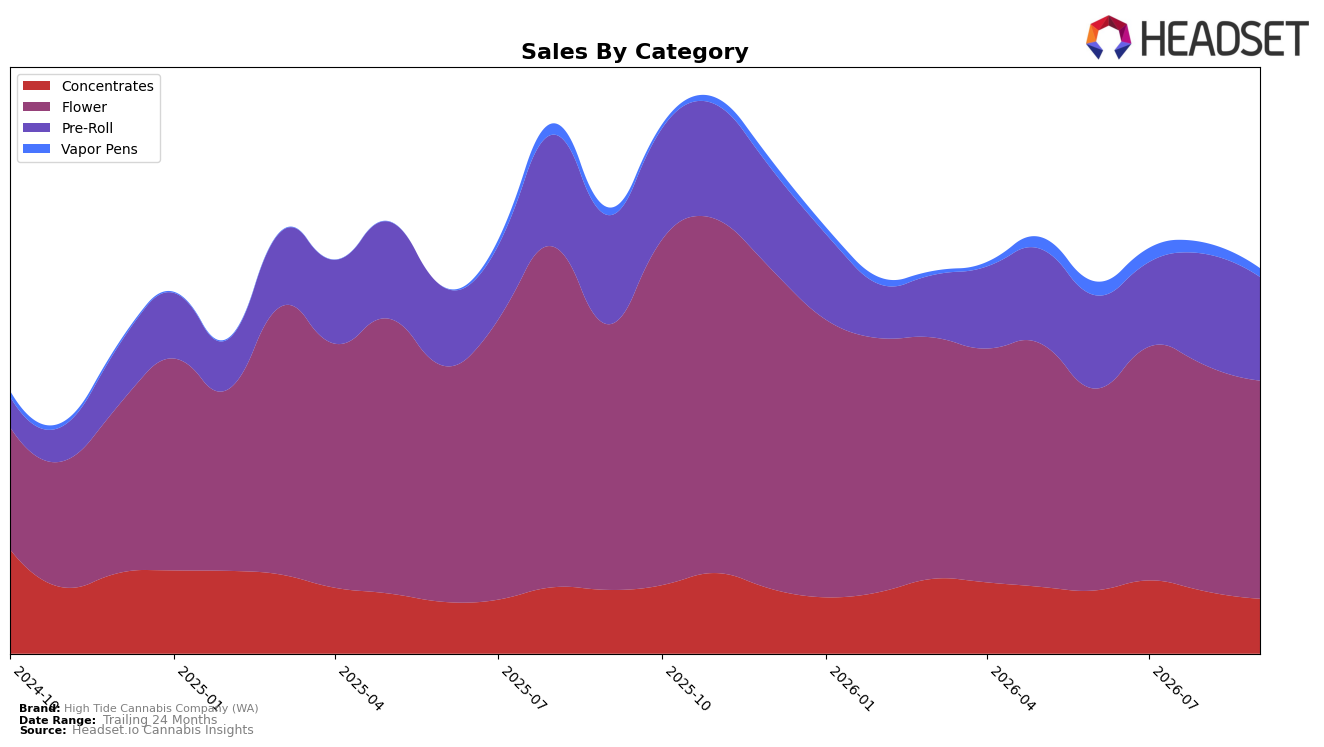
High Tide Cannabis Company (WA) concentrated 56.68% of September 2026 sales in Flower with year-over-year down 17.91% and month-over-month down 3.55%, while Pre-Roll held 26.88% share with year-over-year down 5.09% and month-over-month down 6.80%. Concentrates accounted for 14.23% share with year-over-year down 13.90% and month-over-month down 12.17%, and Vapor Pens were 2.21% share with year-over-year up 14.85% but month-over-month down 22.12%. With the brand’s overall year-over-year sales at -13.66% and average price down 11.24%, the mix skews toward categories posting double-digit year-over-year declines, implying that dependence on Flower and Concentrates is pulling down performance in WA despite a small pocket of growth in Vapor Pens.
The share-weighted dips in Flower (-17.91% YoY) and Concentrates (-13.90% YoY) outweigh the Vapor Pen year-over-year gain of 14.85%, and the month-over-month pressure in Pre-Roll (-6.80%) and Concentrates (-12.17%) compounds the drag from Flower (-3.55%). Ranking 40th in Flower in WA alongside a 22.12% month-over-month drop in Vapor Pens indicates that leaning on Flower for scale while relying on sporadic Vapor Pen lifts is not a durable positioning; the pattern suggests reallocating toward steadier Pre-Roll price-pack architectures while rebuilding Flower velocity is necessary to lower sensitivity to category downturns.
Competitive Landscape
High Tide Cannabis Company (WA) sits at rank #40 in WA Flower in September 2026, down 8 positions year over year from #32, while improving 1 rank from June 2026’s #41; the brand’s prior peak of #21 in November 2025 contrasts with today’s lower placement, indicating a 19-rank slide from peak to current. Against this backdrop, Phat Panda held #1 year over year and remains #1, and Hemp Kings advanced from #24 to #5 alongside a 105.1% YoY sales increase, suggesting High Tide Cannabis Company (WA) lost relative share as faster-rising rivals consolidated top-10 positions; the rank trajectory implies the brand is drifting toward the long tail unless it reverses the multi-period decline.

Notable Products
Cunch Berriez Infused Pre-Roll 2-Pack (1g) posted the steepest decline in September 2026 at -32.6% MoM while sliding to rank 2, and Lemon Cherry Rocket Pre-Roll 2-Pack (1g) fell -16.6% to rank 4, setting a clear downswing for infused and flavored pre-rolls. In contrast, Cornholios Infused Pre-Roll 2-Pack (1g) inched up +5.3% MoM at rank 3, while Blue Nerdz Pre-Roll 2-Pack (1g) dropped -18.7% at rank 5, pointing to fragmentation within the same format. With six of the top ten as Pre-Roll SKUs and Zeclair (3.5g) anchoring Flower at rank 7 alongside Crunch Berriez (3.5g) at rank 9 with a -14.3% MoM dip, the mix implies a pivot toward a two-pillar portfolio where pre-rolls drive velocity but Flower needs price-pack or strain cycling to stabilize.
Top Selling Cannabis Brands






Data for this report comes from real-time sales reporting by participating cannabis retailers via their point-of-sale systems, which are linked up with Headset’s business intelligence software. Headset’s data is very reliable, as it comes digitally direct from our partner retailers. However, the potential does exist for misreporting in the instance of duplicates, incorrectly classified products, inaccurate entry of products into point-of-sale systems, or even simple human error at the point of purchase. Thus, there is a slight margin of error to consider. Brands listed on this page are ranked in the top twenty within the market and product category by total retail sales volume.

