.svg)

Sep-2026
Sales
Trend
6-Month
Product Count
SKUs
Avg Price
YoY Sales Change
YoY Price Change


Where to Buy
Lil' Budz (CT) is stocked at 10 licensed dispensaries across Connecticut, with the deepest coverage in Stamford, Bristol, Manchester, Middlebury, and Newington. Search by ZIP code or city below to find the closest one.
Market Insights Snapshot
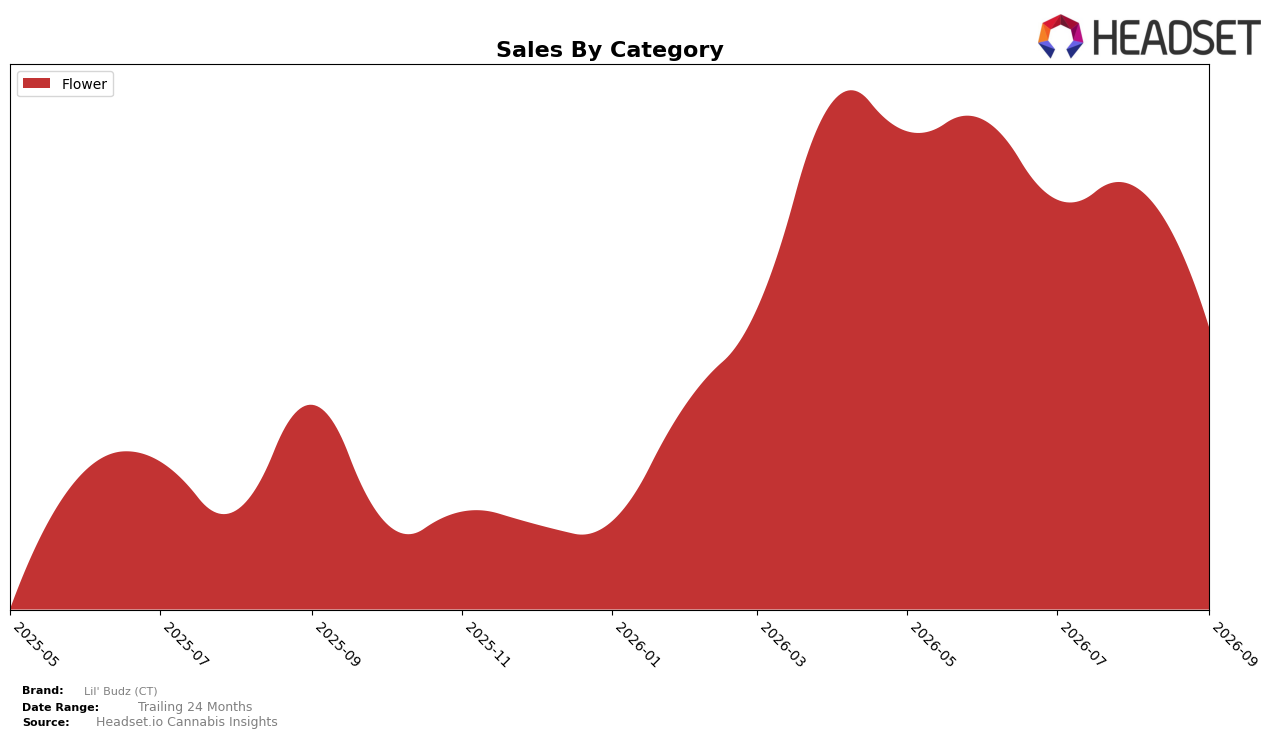
In September 2026, Lil' Budz (CT) operated as a single-category brand with Flower at 100.0% of mix, posting a 34.3% year-over-year sales increase alongside a -32.1% month-over-month decline. The category’s average price of $43.77 sat 19.6% below September 2025 levels while sales share stayed concentrated at 100.0%, and rank in Flower within Connecticut was 16. The pattern implies that September 2026 volume gains versus last year are riding lower unit prices while the MoM dip and mid-teen rank position indicate sensitivity to in-month demand or assortment depth despite a fully concentrated category strategy.
With all sales in Flower and a -19.6% YoY average price shift coexisting with +34.3% YoY sales growth, the brand’s positioning is anchored to value-led Flower that can scale year over year but is exposed to month-to-month volatility of -32.1%. Holding the 16 rank in Connecticut Flower while maintaining a 100.0% category share suggests limited diversification levers; the implication is that sustaining growth will depend on stabilizing Flower velocity rather than mix expansion, as current pricing power appears constrained and rank traction is moderate for September 2026.
Competitive Landscape
Lil' Budz (CT) sits at rank #16 in CT Flower in September 2026, down 3 positions year over year from #13, and 4 spots below its June–August three-month position of #12, indicating slippage from its August 2026 peak of #12. Meanwhile, Let's Burn holds #1, Find. climbed from #12 to #3 with 124.1% YoY sales growth, and Savvy stayed at #2 while contracting 26.8% YoY, suggesting Lil' Budz (CT) is being outpaced by both fast risers and incumbents despite some peers retrenching. The pattern implies Lil' Budz (CT)’s rank trajectory—falling 3 places YoY and slipping 4 spots from its recent peak—signals share pressure that likely persists without a catalyst to reverse the downtrend.

Notable Products
Chem D Smalls (7g) posted the steepest decline in September 2026 with a -74.7% month-over-month drop while holding rank 4, and Soap Smalls (7g) also contracted -17.4% at rank 3. lung Buster Smalls (7g) led the lineup at rank 1, and Afgooey Smalls (7g) followed at rank 2, while Bananaconda Smalls (7g) was the only notable mover with a +21.7% MoM gain at rank 8. Nine of the top ten are Flower SKUs and include multiple Smalls pack sizes, with Govmint Oasis Smalls (14g) anchoring value at rank 9 and $12,956 in sales. The pattern implies a portfolio leaning on Smalls Flower where sharp volatility in individual strains coexists with stable rank leadership, pointing to a need for tighter strain rotation and inventory timing.
Top Selling Cannabis Brands






Data for this report comes from real-time sales reporting by participating cannabis retailers via their point-of-sale systems, which are linked up with Headset’s business intelligence software. Headset’s data is very reliable, as it comes digitally direct from our partner retailers. However, the potential does exist for misreporting in the instance of duplicates, incorrectly classified products, inaccurate entry of products into point-of-sale systems, or even simple human error at the point of purchase. Thus, there is a slight margin of error to consider. Brands listed on this page are ranked in the top twenty within the market and product category by total retail sales volume.

