.svg)
Aug-2026
Sales
Trend
6-Month
Product Count
SKUs
Avg Price
YoY Sales Change
YoY Price Change



Market Insights Snapshot
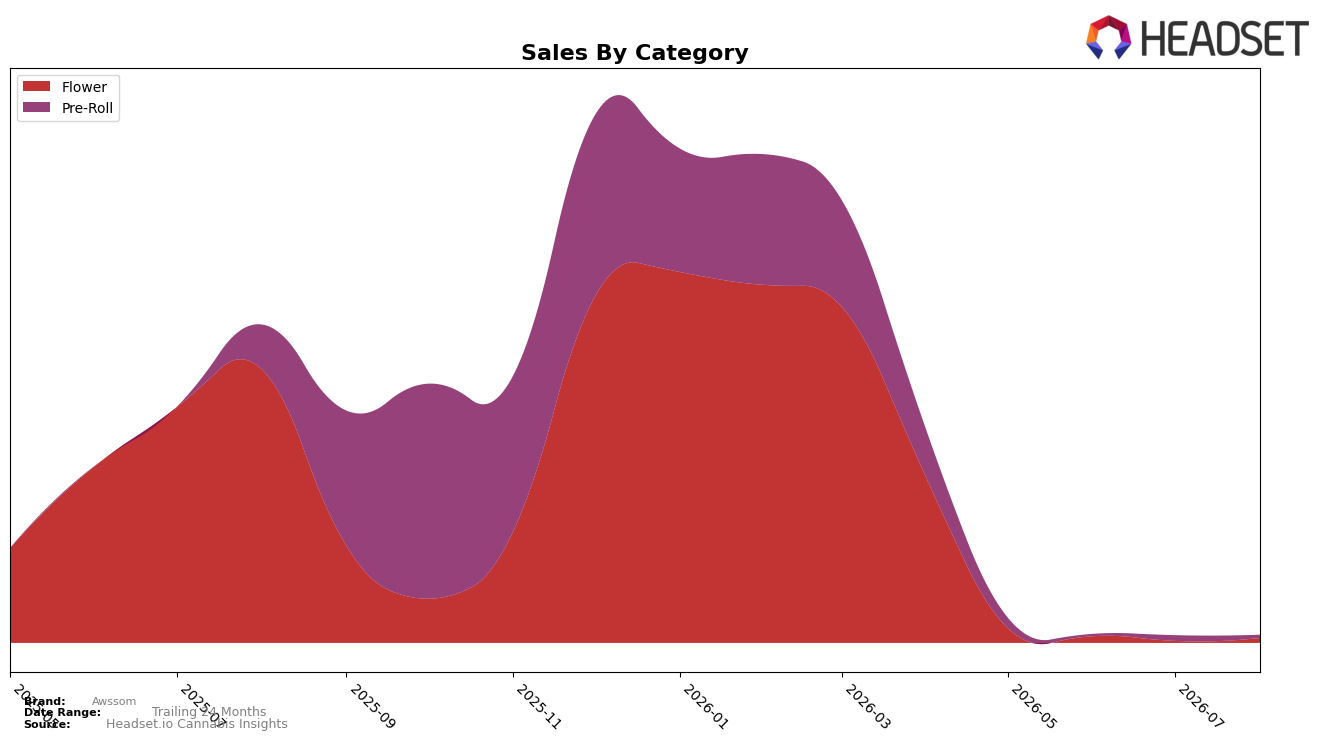
In August 2026, Awssom’s mix concentrated in Flower at 62.02% share with year-over-year sales down 98.30% but month-over-month up 180.36%, while Pre-Roll held 37.98% share with year-over-year sales down 93.59% and month-over-month down 46.98%. The brand-level average price fell 37.51% year over year alongside a 97.64% year-over-year sales decline, and Flower carried a substantially higher average price at $31.19 versus $7.63 in Pre-Roll. With Connecticut as the top market and Flower as the top category, the mix now leans into a higher-priced segment even as overall demand contracted, implying the brand is relying on a narrow rebound in Flower to offset a retreat in Pre-Roll.
The divergent momentum—Flower’s 180.36% month-over-month surge against Pre-Roll’s 46.98% month-over-month drop—along with a 62.02% Flower share and a 37.51% year-over-year price compression, implies that Awssom is trading volume volatility in lower-priced Pre-Roll for a higher-ticket Flower focus. Given the 98.30% year-over-year Flower decline and the 93.59% year-over-year Pre-Roll decline, the month-over-month Flower uptick likely reflects inventory or distribution timing rather than broad demand recovery, positioning the brand to prioritize depth in Flower in Connecticut while managing margin pressure from lower prices.
Competitive Landscape
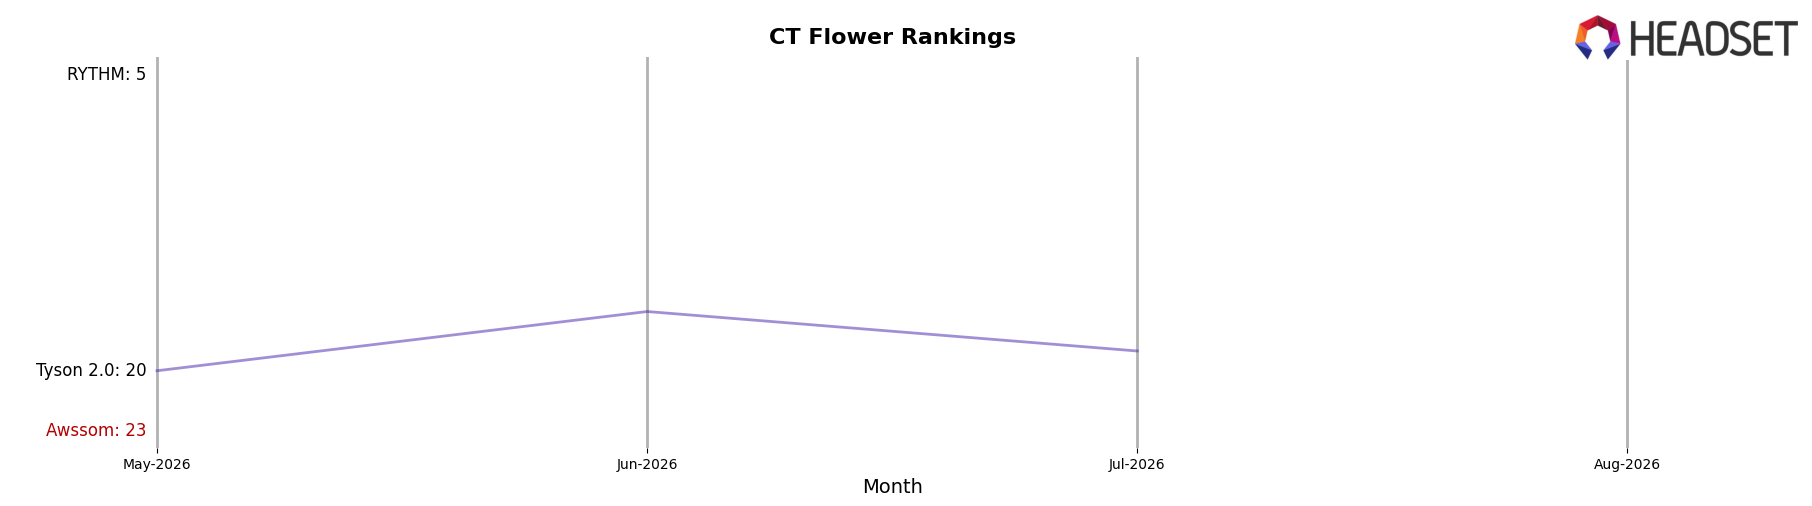
Awssom is ranked #26 in CT Flower in August 2026, down 16 positions year over year from #10, and 3 spots lower versus May 2026 when it was #23; by contrast, Theraplant rose to #1 from #8 year over year while Comffy sits at #3 after improving from #7 year over year, indicating peers are moving up as Awssom drifts down. Awssom’s peak of #8 in March 2026 versus its current #26 marks an 18-rank slide, while Find. advanced to #4 from #13 year over year alongside a 167.9% sales increase; this divergence implies Awssom is losing share-of-mind to faster-ascending competitors and must reverse rank momentum to avoid further aisle invisibility.
Notable Products
Blueberry Hashplant Pre Ground (7g) delivered the standout move in August 2026 with a +460.5% month-over-month surge to rank 2, while Jet Fuel OG Pre-Roll (1g) fell -53.2% into rank 1, creating an unusual inversion where the top-ranked SKU is simultaneously in steep decline. Gold Cash Gold Pre-Roll (1g) also contracted -26.2% at rank 3, and with two Pre-Rolls in the top three, Pre-Roll SKUs account for two of the top three positions even as the Flower entry posted the month’s largest gain. The split between a collapsing leader and an accelerating Flower value-size SKU implies a pivot toward bulk Flower demand that could reweight Awssom’s mix away from single-serve Pre-Rolls and toward larger-format Flower in upcoming months.
Top Selling Cannabis Brands






Data for this report comes from real-time sales reporting by participating cannabis retailers via their point-of-sale systems, which are linked up with Headset’s business intelligence software. Headset’s data is very reliable, as it comes digitally direct from our partner retailers. However, the potential does exist for misreporting in the instance of duplicates, incorrectly classified products, inaccurate entry of products into point-of-sale systems, or even simple human error at the point of purchase. Thus, there is a slight margin of error to consider. Brands listed on this page are ranked in the top twenty within the market and product category by total retail sales volume.

