Jan-2026
Sales
Trend
6-Month
Product Count
SKUs
Overview
Market Insights Snapshot
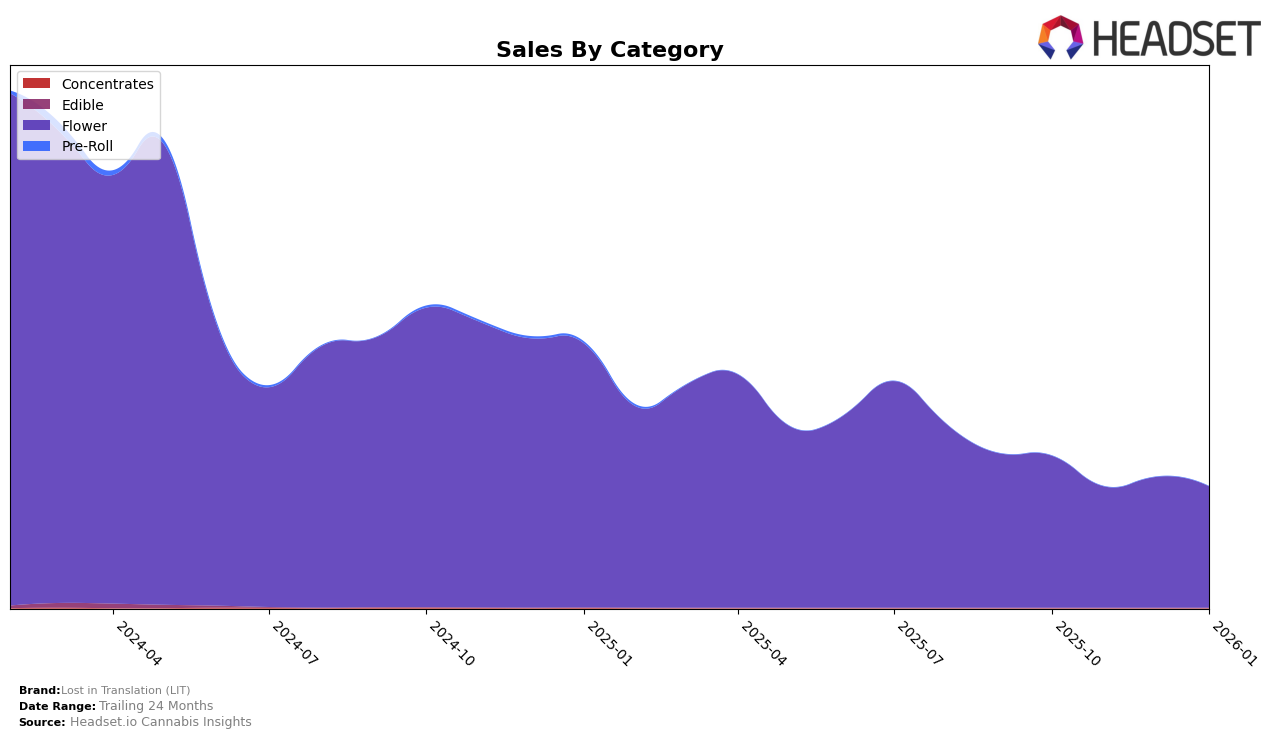
In the state of Colorado, Lost in Translation (LIT) has shown consistent performance in the Flower category, maintaining a presence within the top 30 brands over the past four months. Starting at rank 20 in October 2025, LIT experienced a slight dip to rank 27 in November, but managed to recover slightly by moving up to rank 25 by January 2026. This indicates a resilient position in the market despite fluctuations. The sales figures correspond with these rankings, showing a peak in October followed by a decrease in November, and a modest rebound in December and January. Such trends suggest that while LIT faces competition, it remains a notable player in the Colorado market.
Conversely, in Missouri, LIT's presence in the Flower category is less prominent, as it did not make the top 30 brands in October 2025. However, it entered the rankings in November at position 66 and maintained a similar standing through January 2026, despite a gradual decline in sales. This performance indicates a challenging market environment for LIT in Missouri, where the brand struggles to capture a significant market share. The absence from the top 30 in October and the subsequent low rankings suggest that LIT may need to explore strategic initiatives to enhance its competitive edge and market penetration in Missouri.
Competitive Landscape
In the competitive landscape of the Colorado flower category, Lost in Translation (LIT) has experienced a dynamic shift in its market positioning over the past few months. Starting from a strong position at rank 20 in October 2025, LIT saw a decline to rank 27 in November, before stabilizing slightly at ranks 26 and 25 in December and January, respectively. This fluctuation in rank is notable when compared to competitors like Summit, which maintained a relatively stable presence, hovering around the 20-27 rank range, and Host, which improved its rank from 30 in October to 24 in January. Meanwhile, The Organic Alternative showed a similar pattern of rank fluctuation to LIT, suggesting a competitive tussle for market share. Despite these rank changes, LIT's sales figures indicate resilience, with a notable sales peak in October followed by a slight decline, yet remaining competitive against brands like Pot Zero, which saw more volatile sales performance. These insights suggest that while LIT faces strong competition, its ability to maintain a top 25 position amidst fluctuating ranks and sales highlights its potential for strategic growth in the Colorado flower market.

Notable Products
In January 2026, the top-performing product from Lost in Translation (LIT) was Golden Goat (3.5g) in the Flower category, claiming the number one rank with sales of 1203 units. Ecto Cooler B-Bud (7g) maintained its position at rank two, demonstrating consistent performance from December 2025. Gelato Cake B-Bud (7g) improved its standing from fourth to third place, indicating a positive trend in sales. Golden Goat (Bulk), previously the top-ranked product in December, dropped to fourth position, showing a decline in sales figures. Grape Cream Cake (3.5g) fell to fifth place, despite having been ranked second in November 2025, reflecting a downward shift in consumer preference.
Top Selling Cannabis Brands
Data for this report comes from real-time sales reporting by participating cannabis retailers via their point-of-sale systems, which are linked up with Headset’s business intelligence software. Headset’s data is very reliable, as it comes digitally direct from our partner retailers. However, the potential does exist for misreporting in the instance of duplicates, incorrectly classified products, inaccurate entry of products into point-of-sale systems, or even simple human error at the point of purchase. Thus, there is a slight margin of error to consider. Brands listed on this page are ranked in the top twenty within the market and product category by total retail sales volume.


