Jun-2026
Sales
Trend
6-Month
Product Count
SKUs
Avg Price
YoY Sales Change
YoY Price Change
Market Insights Snapshot
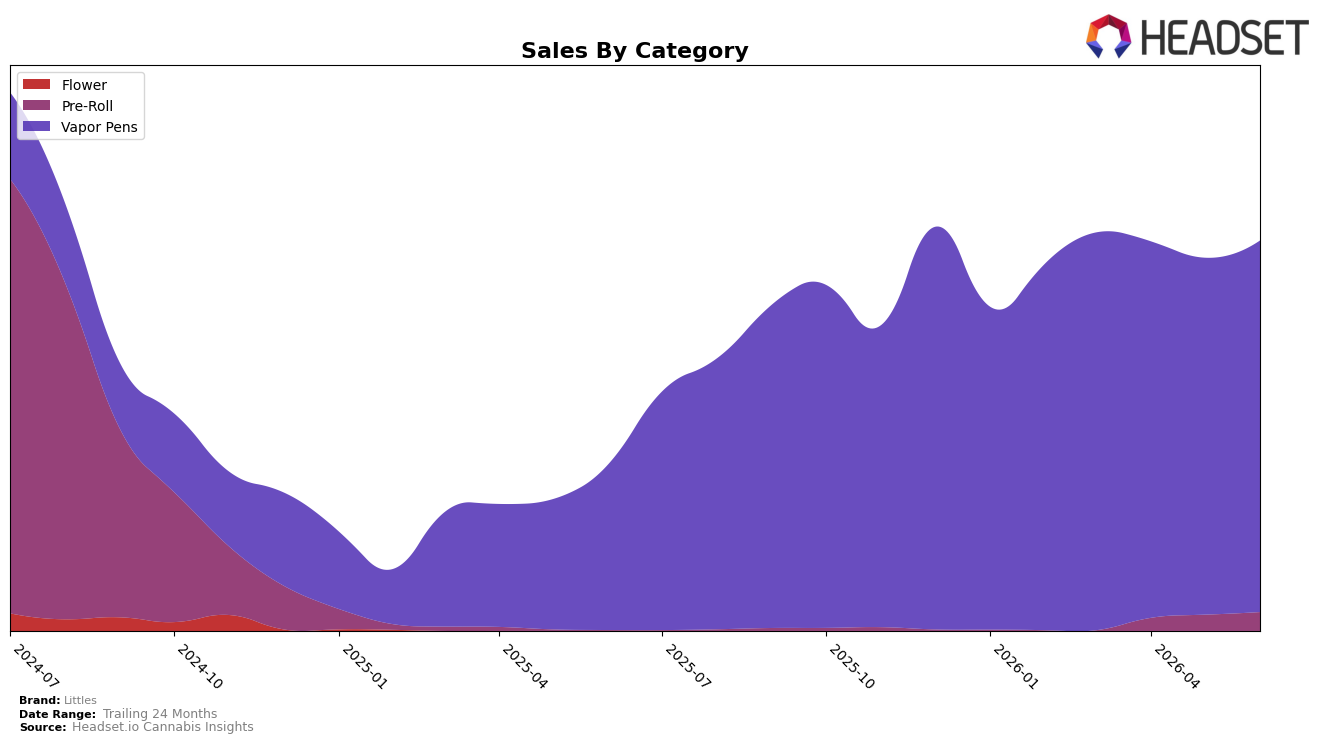
In June 2026, Vapor Pens held 95.26% share with a 124.52% year-over-year lift and a 4.10% month-over-month gain, while Pre-Roll accounted for 4.74% share with a 3,610.98% year-over-year surge and a 16.32% month-over-month increase. Despite brand sales up 134.98% year over year and average price down 18.30% year over year to $38.02, the mix remains highly concentrated in Vapor Pens, complemented by a small but rapidly accelerating Pre-Roll line. With Vapor Pens ranked 26th in New York and Pre-Roll expanding faster on both a year-over-year and month-over-month basis, the pattern implies Littles is using price-led momentum in a dominant core to seed diversification without diluting the flagship.
The widening gap between mix concentration (95.26% in Vapor Pens) and growth velocity (Pre-Roll up 16.32% month over month vs. Vapor Pens up 4.10% month over month) signals a pivot point where incremental share gains likely come from accelerating the secondary category rather than pushing the saturated core. With a 124.52% year-over-year increase in Vapor Pens still outpaced by the brand’s 134.98% year-over-year total growth, and a 3,610.98% year-over-year spike in Pre-Roll contributing a 4.74% share, the implication is that portfolio risk is reduced by nurturing the faster-moving tail while maintaining rank 26 in New York through pricing and mix tuning.
Competitive Landscape
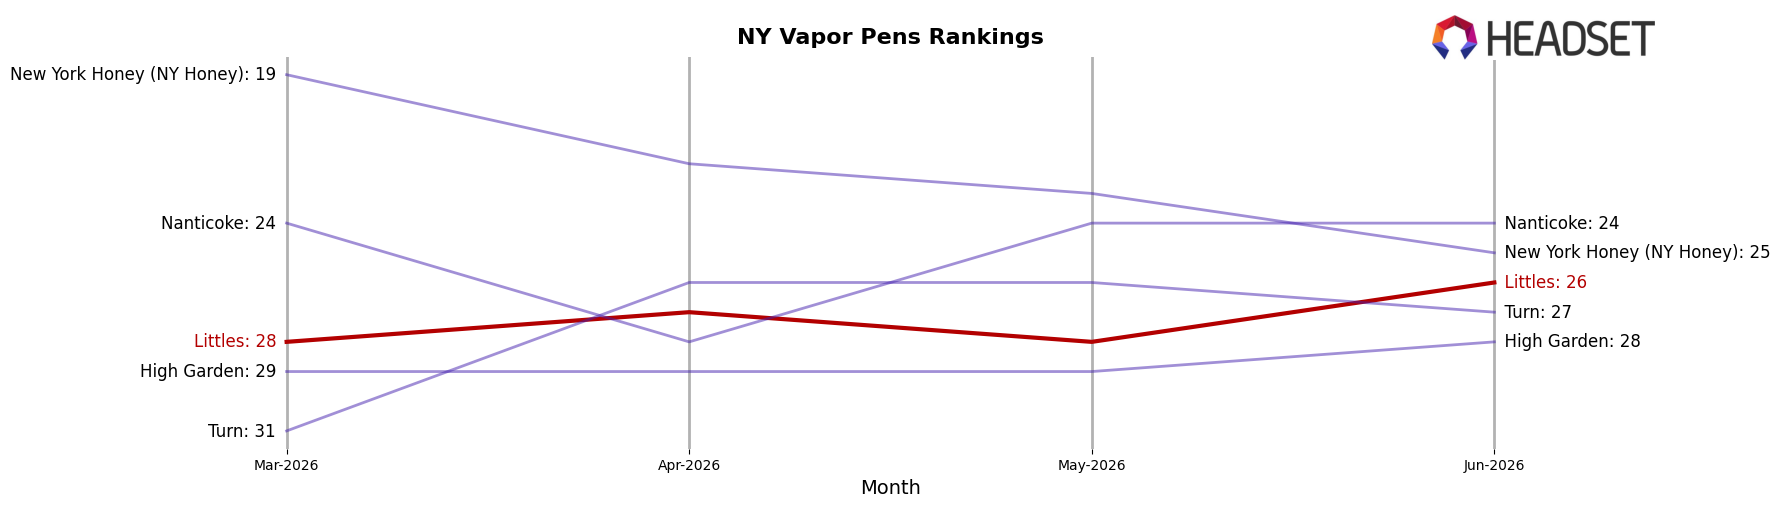
In New York Vapor Pens, Littles sits at rank #26 in June 2026, improving 11 places from #37 year over year, and edging up 2 spots from #28 three months ago; this month also marks its peak rank of #26. Against this backdrop, Fernway rose from #3 to #2 with a 40.0% YoY sales increase while Ayrloom slipped from #2 to #3 with a 19.6% YoY decline, and Jetty Extracts vaulted from #23 to #5 on 238.2% YoY growth, indicating that mid-pack mobility is accelerating even as category leaders consolidate. The pattern implies Littles’ upward rank trajectory is real but vulnerable: modest sequential lift (+2 ranks since March 2026) amid rapid competitor gains suggests share capture will require outpacing double-digit growth pockets rather than incremental moves.
Notable Products
Watermelon Punch Live Resin Disposable (1g) posted the standout move in June 2026 with a +64.2% month-over-month surge and a jump into rank 5, while Pink Berry Live Resin Disposable (1g) fell -25.4% and slipped to rank 6; this simultaneous lift and drop inside the same form factor signals shifting flavor preferences rather than category momentum. Blueberry Jam Live Resin Disposable (1g) held rank 1 despite a -6.8% decline, and Tangie Cookies Live Resin Disposable (1g) at rank 2 dipped -4.6%, indicating leadership is intact but softening at the top. Eight of the top ten are Vapor Pens SKUs from the same Live Resin Disposable family, and Blue Octane Live Resin Disposable (1g) at rank 8 grew +10.9% alongside Birthday Cake Live Resin Disposable (1g) at rank 8 with +0.9%, concentrating sales in a narrow portfolio with $48,524 anchored in the lead item. The pattern implies Littles is consolidating around Live Resin Disposables with volatility concentrated in flavors, suggesting mix management and limited new-format expansion will shape near-term commercial direction.
Top Selling Cannabis Brands
Data for this report comes from real-time sales reporting by participating cannabis retailers via their point-of-sale systems, which are linked up with Headset’s business intelligence software. Headset’s data is very reliable, as it comes digitally direct from our partner retailers. However, the potential does exist for misreporting in the instance of duplicates, incorrectly classified products, inaccurate entry of products into point-of-sale systems, or even simple human error at the point of purchase. Thus, there is a slight margin of error to consider. Brands listed on this page are ranked in the top twenty within the market and product category by total retail sales volume.

