May-2026
Sales
Trend
6-Month
Product Count
SKUs
Avg Price
YoY Sales Change
YoY Price Change
Market Insights Snapshot
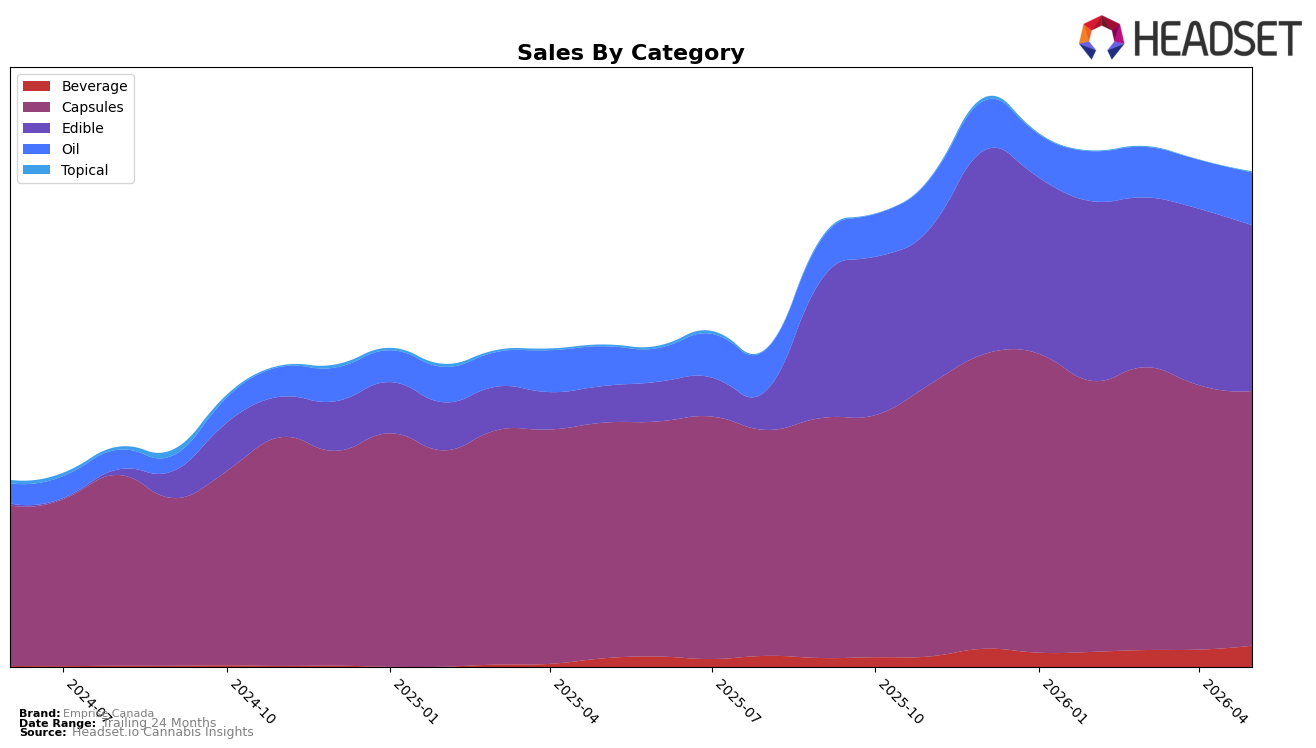
In May 2026, Emprise Canada leaned heavily into Capsules at 51.23% share with year-over-year growth of 8.06% but a month-over-month decline of 3.73%, while Edible expanded to 33.39% share on a 348.26% YoY surge and a 5.99% MoM pullback; Oil held 10.69% share with 32.75% YoY and 7.77% MoM growth as Beverage reached 4.38% share with 137.29% YoY and 21.92% MoM gains. Despite a 43.63% YoY increase in average price to $20.71, category pricing was mixed, with Capsules averaging 37.998 and Edible at 20.084, indicating trade-up within Capsules alongside value-oriented Edible growth; the pattern points to a portfolio skew where Capsules remain the anchor while Edible and Beverage provide the velocity, implying a broadened demand curve rather than concentration risk.
The mix shift suggests Emprise Canada is consolidating a premium efficacy position in Capsules—reinforced by a rank of 2 in Capsules in British Columbia—while cultivating accessible trial and frequency via Edible and Beverage, as evidenced by Edible’s 348.26% YoY lift and Beverage’s 21.92% MoM uptick. With Oil’s 7.77% MoM growth and Topical’s 103.02% MoM rebound off a small 0.30% share base, the near-term implication is a barbell where Capsules defend share and margin and faster-cycling formats absorb price-sensitive demand; this positioning supports sustained YoY brand sales growth of 53.38% while mitigating monthly volatility from the 3.73% Capsules MoM decline and 5.99% Edible MoM decline.
Competitive Landscape
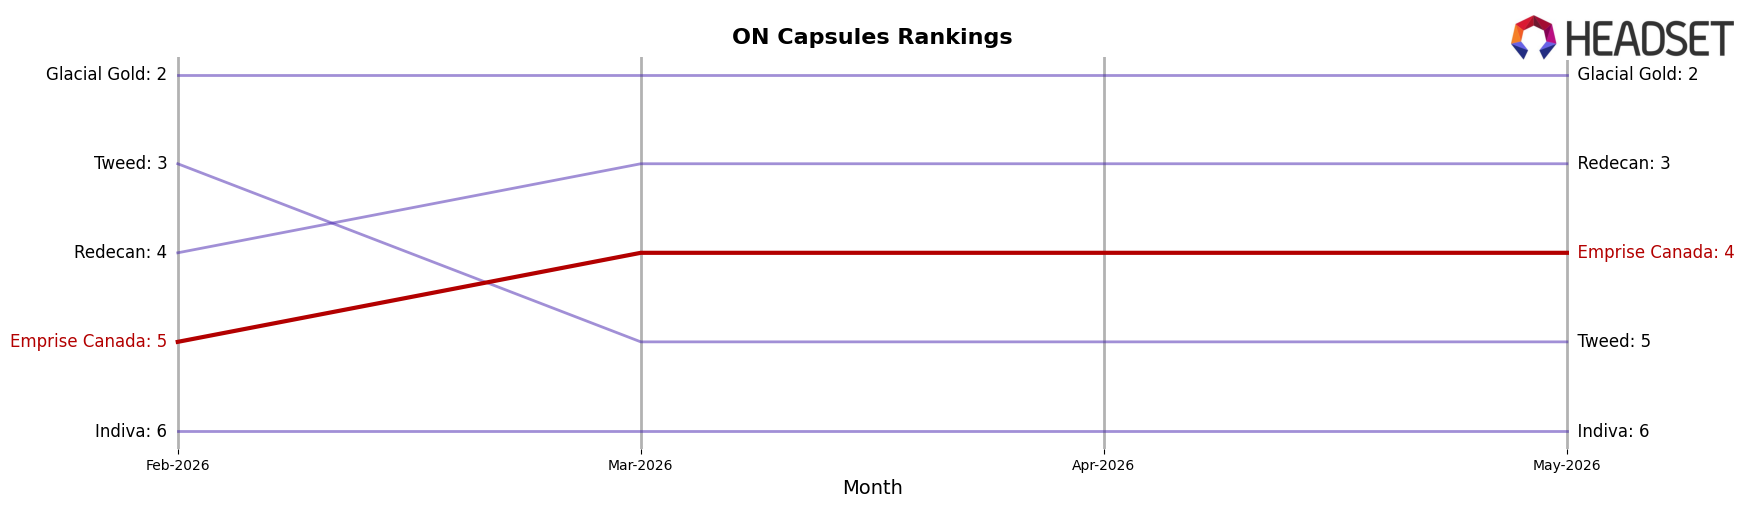
Emprise Canada is ranked #4 in ON Capsules in May 2026, improving 1 rank position from #5 year over year, while its 3-month position held at #5 and its peak rank of #4 also occurred in May 2026; in contrast, Glacial Gold rose from #4 to #2 with a 39.1% YoY sales change, and Tweed fell from #2 to #5 alongside a 47.4% YoY sales decline, indicating Emprise Canada’s upward shift is tied to competitor reshuffling rather than broad category expansion and implies a path to #3 hinges on outpacing Redecan at #3 despite Redecan’s 36.7% YoY contraction.
Notable Products
Rapid - Orange Sativa Gummy (10mg) posted the steepest decline in May 2026 at -25.7% MoM, sliding to rank 7 from within the top tier while ThirstC - Blue Raspberry Instant Drink (10mg) rose 23.3% to rank 1. ThirstC- Grape Instant Drink Mix (10mg) gained 19.9% at rank 4 as ThirstC - Cherry Instant Drink Mix (10mg) fell -9.0% at rank 2, and four of the top ten are Beverage SKUs, concentrating momentum in powdered drinks rather than gummies. CBD/THC 1:1 Balanced Softgels 100-Pack (1000mg CBD, 1000mg THC) held rank 5 with +7.9% MoM and the highest single-month revenue at $126,986 while CBN/CBD 1:5 Softgels 30-Pack (300mg CBN, 1500mg CBD) dipped -3.6% at rank 10, implying capsule demand is steady but not accelerating. Together, the gains in two Beverage leaders alongside a double-digit gummy decline indicate a commercial tilt toward instant drink formats for share defense, with capsules providing a stable base rather than the primary growth engine.
Top Selling Cannabis Brands
Data for this report comes from real-time sales reporting by participating cannabis retailers via their point-of-sale systems, which are linked up with Headset’s business intelligence software. Headset’s data is very reliable, as it comes digitally direct from our partner retailers. However, the potential does exist for misreporting in the instance of duplicates, incorrectly classified products, inaccurate entry of products into point-of-sale systems, or even simple human error at the point of purchase. Thus, there is a slight margin of error to consider. Brands listed on this page are ranked in the top twenty within the market and product category by total retail sales volume.

