Nov-2025
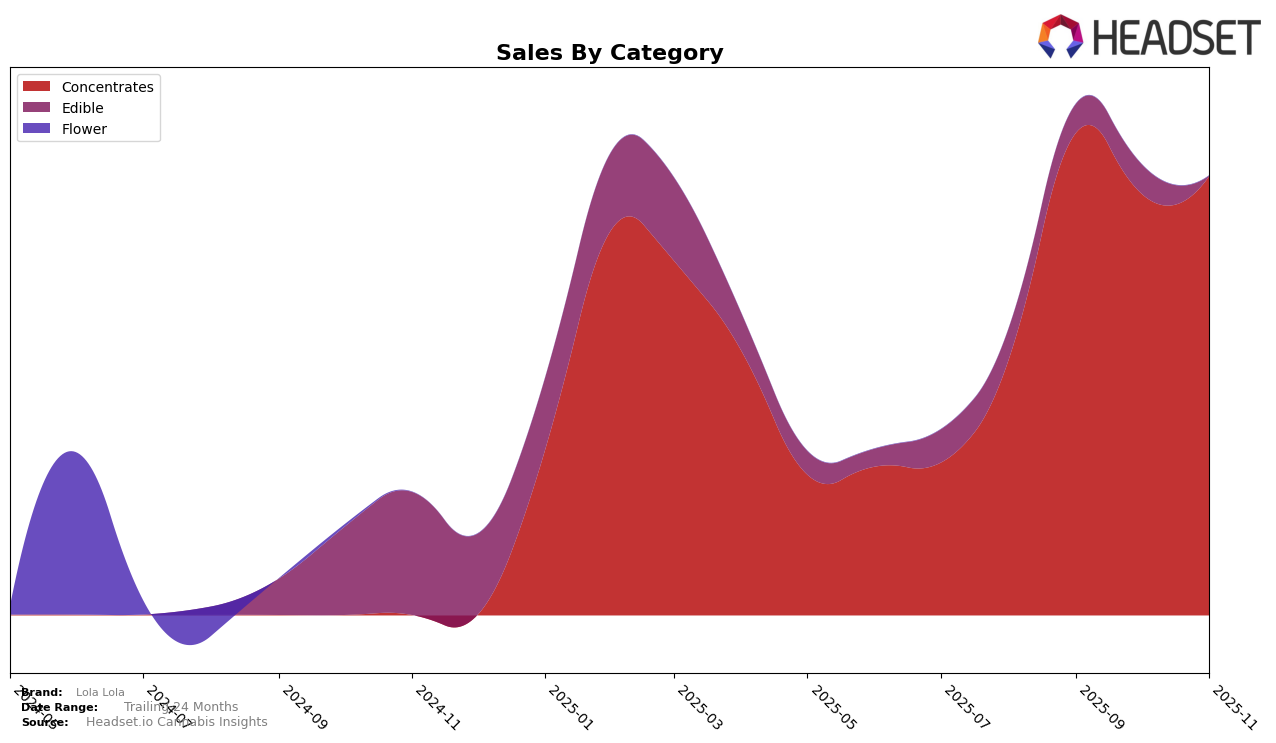
Sales
Trend
6-Month
Product Count
SKUs
Avg Price
YoY Sales Change
YoY Price Change
Market Insights Snapshot
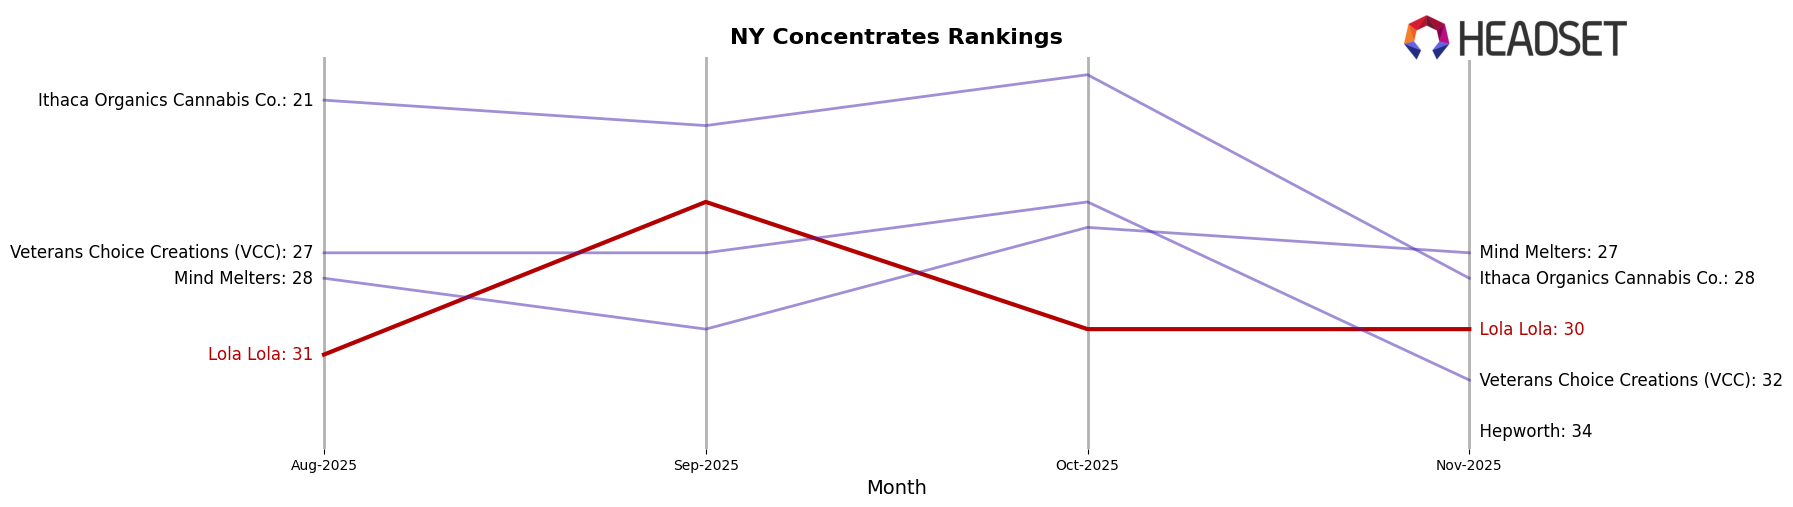
Lola Lola has shown a consistent presence in the New York concentrates category over the past few months. Despite a challenging start in August 2025, where the brand ranked 31st and was not in the top 30, Lola Lola made a notable improvement in September by climbing to the 25th position. However, the brand's ranking slipped back to 30th in October and maintained the same position in November. This fluctuation indicates a period of volatility, yet the brand's ability to remain in the top 30 in subsequent months suggests a resilient market presence.
The sales figures for Lola Lola in New York reflect an upward trajectory from August to November 2025, with a significant jump in September. This increase in sales, despite the fluctuations in ranking, highlights a strong consumer demand and potential growth opportunities for the brand in the concentrates category. The brand's performance in New York's competitive market is a testament to its ability to navigate market dynamics, although maintaining a higher rank remains a challenge. Observing how Lola Lola adapts its strategies to improve its standing could provide valuable insights into its future performance.
```Competitive Landscape
In the New York concentrates market, Lola Lola has shown a fluctuating performance in recent months, with its rank improving from 31st in August 2025 to 25th in September, before slipping back to 30th in October and maintaining that position in November. This fluctuation suggests a competitive landscape where Lola Lola faces significant challenges. Notably, Ithaca Organics Cannabis Co. consistently ranks higher, peaking at 20th in October, indicating a strong market presence. Meanwhile, Veterans Choice Creations (VCC) and Mind Melters have also shown competitive sales figures, with VCC briefly surpassing Lola Lola in October. Despite these challenges, Lola Lola's sales have shown resilience, with a slight upward trend from October to November, suggesting potential for recovery and growth in the coming months. The absence of Hepworth from the top 20 until November indicates a less consistent market impact, providing a potential opportunity for Lola Lola to capitalize on its fluctuating competitors.
Notable Products
In November 2025, Iced Sangria Live Rosin Badder (1g) from Lola Lola emerged as the top-performing product, securing the number one rank in the Concentrates category with sales reaching 591 units. This product climbed from its third position in October to take the lead. Sour Gorilla Live Rosin Budder (1g) maintained a strong presence, holding steady at the second rank, though its sales saw a slight decrease from the previous month. The CBD/CBG/THC 1:1:1 Synergy Watermelon Mint Gummies, which previously held the top spot in October, did not appear in the November rankings, indicating a potential shift in consumer preference. Overall, the Concentrates category showed consistent top performance for Lola Lola in November.
Top Selling Cannabis Brands
Data for this report comes from real-time sales reporting by participating cannabis retailers via their point-of-sale systems, which are linked up with Headset’s business intelligence software. Headset’s data is very reliable, as it comes digitally direct from our partner retailers. However, the potential does exist for misreporting in the instance of duplicates, incorrectly classified products, inaccurate entry of products into point-of-sale systems, or even simple human error at the point of purchase. Thus, there is a slight margin of error to consider. Brands listed on this page are ranked in the top twenty within the market and product category by total retail sales volume.

