.svg)

Sep-2026
Sales
Trend
6-Month
Product Count
SKUs
Avg Price
YoY Sales Change
YoY Price Change


Market Insights Snapshot
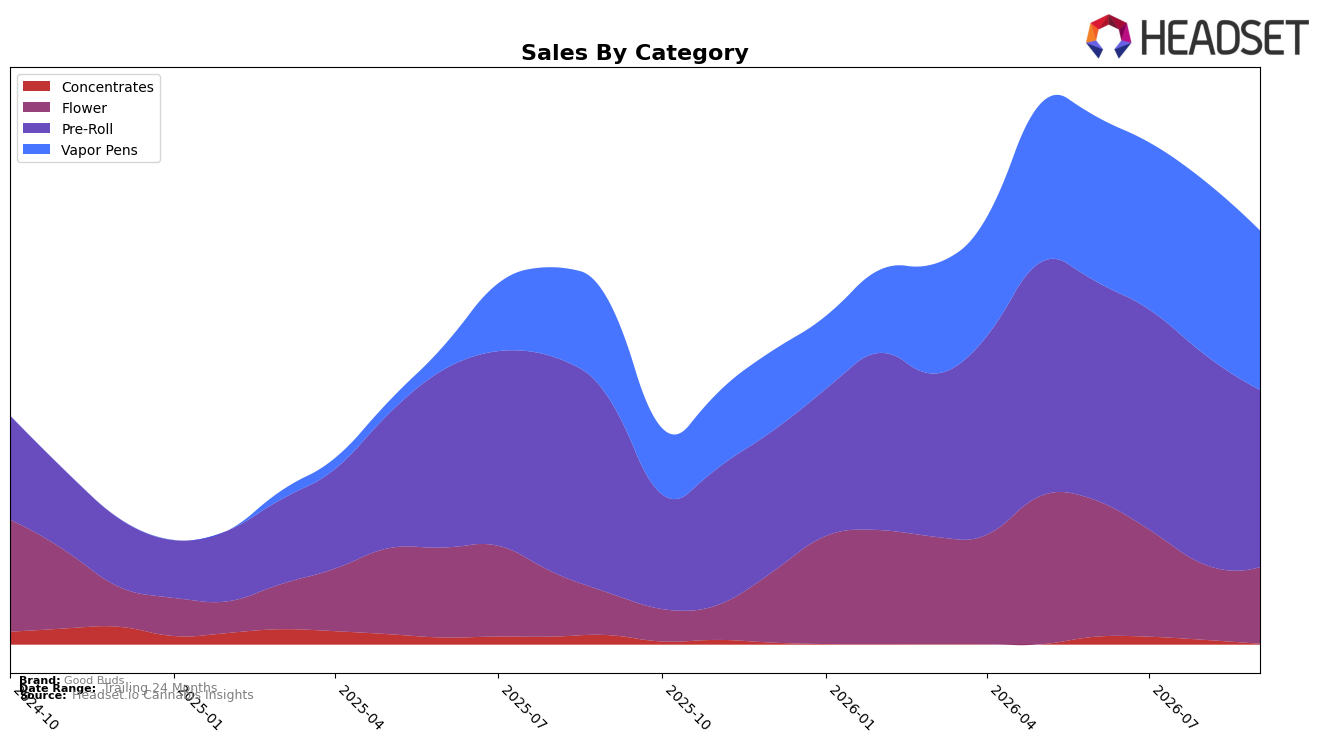
Good Buds shifted its category mix in September 2026 toward higher-value formats despite a headline pullback in its historical anchor. Pre-Roll still holds the largest share at 42.82%, but with a -9.37% year-over-year decline and a -15.71% month-over-month drop, while Vapor Pens rose to 38.52% share on 64.18% year-over-year growth despite an -8.14% month-over-month dip. Flower expanded to 18.49% share with 81.45% year-over-year growth and a 1.85% month-over-month increase, and Concentrates compressed to 0.17% share with -92.59% year-over-year and -84.91% month-over-month declines. The category pattern implies a deliberate migration from low-price volume (Pre-Roll average price $14.31) toward premiumized baskets in Vapor Pens (average price $37.05) and Flower, reallocating mix even as near-term volatility trims month-over-month momentum.
The mix shift positions Good Buds to compete on premium inhalables where pricing power can offset volume softness, particularly as average brand price rose 0.76% year over year while total brand sales increased 20.25% year over year. With Vapor Pens as the top category and a rank of 10 in Vapor Pens in British Columbia, the combination of 64.18% year-over-year growth in Vapor Pens and 81.45% in Flower strengthens relevance in higher-ticket segments even as Pre-Roll contracts -15.71% month over month. The implication is a pivot toward margin-accretive SKUs that supports sustained growth despite category-level churn, using expanding Flower share (+1.85% month over month) and elevated Vapor Pen share (38.52%) to anchor positioning.
Competitive Landscape
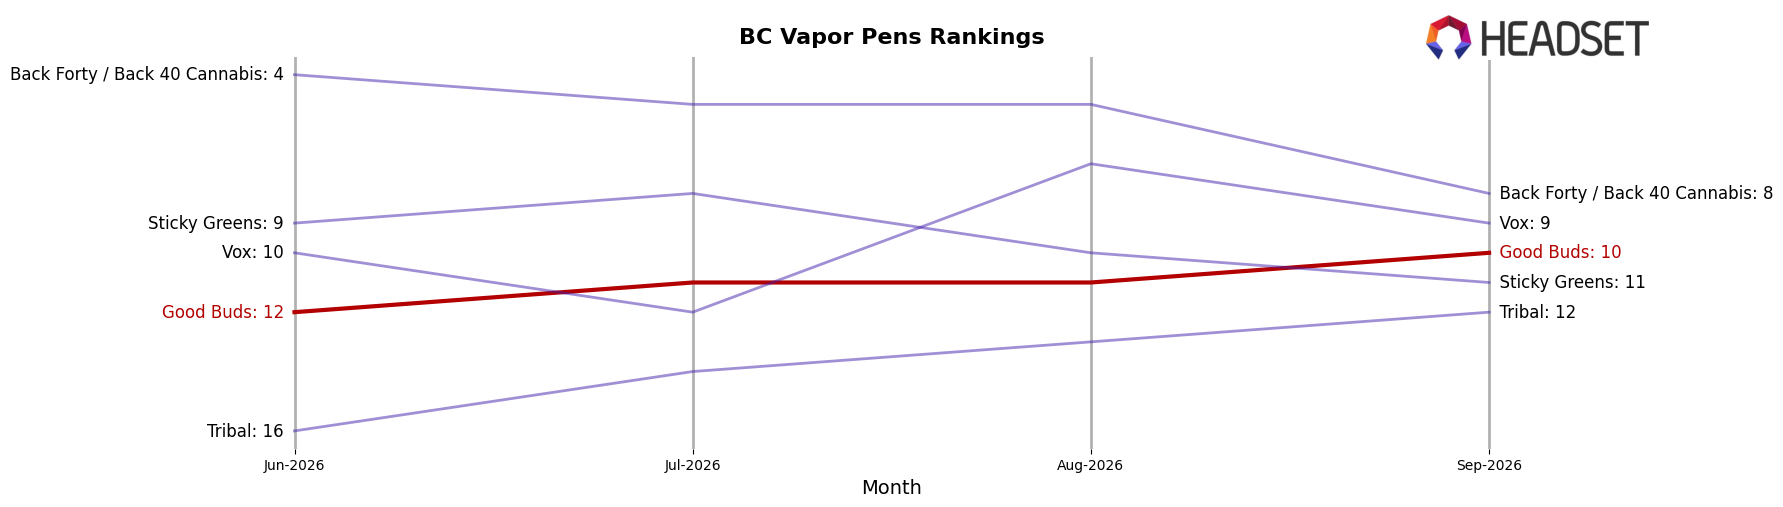
Good Buds sits at rank #10 in BC Vapor Pens in September 2026, improving 12 positions from #22 year over year, and edging up 2 spots from #12 in June 2026; this ties its peak rank of #10 in September 2026 while closing a portion of the gap to the top 5. In contrast, BoxHot holds #1 with a 35.9% year-over-year sales increase, while General Admission sits at #3 after a decline of 1 position alongside a −13.9% sales change, and 1964 Supply Co climbed from #11 to #4 with 91.1% growth. With Spinach advancing from #3 to #2 on 178.8% growth while Good Buds advances more modestly in rank, the pattern implies Good Buds is gaining placement but must accelerate share capture to convert a top-10 foothold into sustained top-5 contention.
Notable Products
Timewarp Cured Resin Disposable (1g) posted the steepest decline in September 2026 at -33.6% and slid to rank 10, while Timewarp Pre-Roll (1g) fell -32.7% to rank 3, signaling concentrated pressure on the Timewarp line. BC Organic - Gluerangutan Pre-Roll (1g) held rank 1 despite a -4.6% dip, whereas Mango Cake Pre-Roll 2-Pack (1g) dropped -21.7% at rank 2; by contrast, Mango Cake (3.5g) rose +9.7% at rank 6 and Gluerangatan (7g) grew +8.7% at rank 7. Four of the top ten are Pre-Roll SKUs, yet three Vapor Pens in the top ten all declined between -20.6% and -33.6%, pointing to channel drag in inhalables beyond single joints. The mix implies Good Buds is leaning back toward Flower-led velocity while premium Pre-Roll flagships protect visibility at the top of the chart despite softness in multi-pack and vape extensions.
Top Selling Cannabis Brands






Data for this report comes from real-time sales reporting by participating cannabis retailers via their point-of-sale systems, which are linked up with Headset’s business intelligence software. Headset’s data is very reliable, as it comes digitally direct from our partner retailers. However, the potential does exist for misreporting in the instance of duplicates, incorrectly classified products, inaccurate entry of products into point-of-sale systems, or even simple human error at the point of purchase. Thus, there is a slight margin of error to consider. Brands listed on this page are ranked in the top twenty within the market and product category by total retail sales volume.

