.svg)

Sep-2026
Sales
Trend
6-Month
Product Count
SKUs
Avg Price
YoY Sales Change
YoY Price Change


Where to Buy
Mari's is stocked at 156 licensed dispensaries across Washington, with the deepest coverage in Spokane, Seattle, Tacoma, Vancouver, and Bellingham. Search by ZIP code or city below to find the closest one, or filter by product type if you are after a specific format.
Market Insights Snapshot
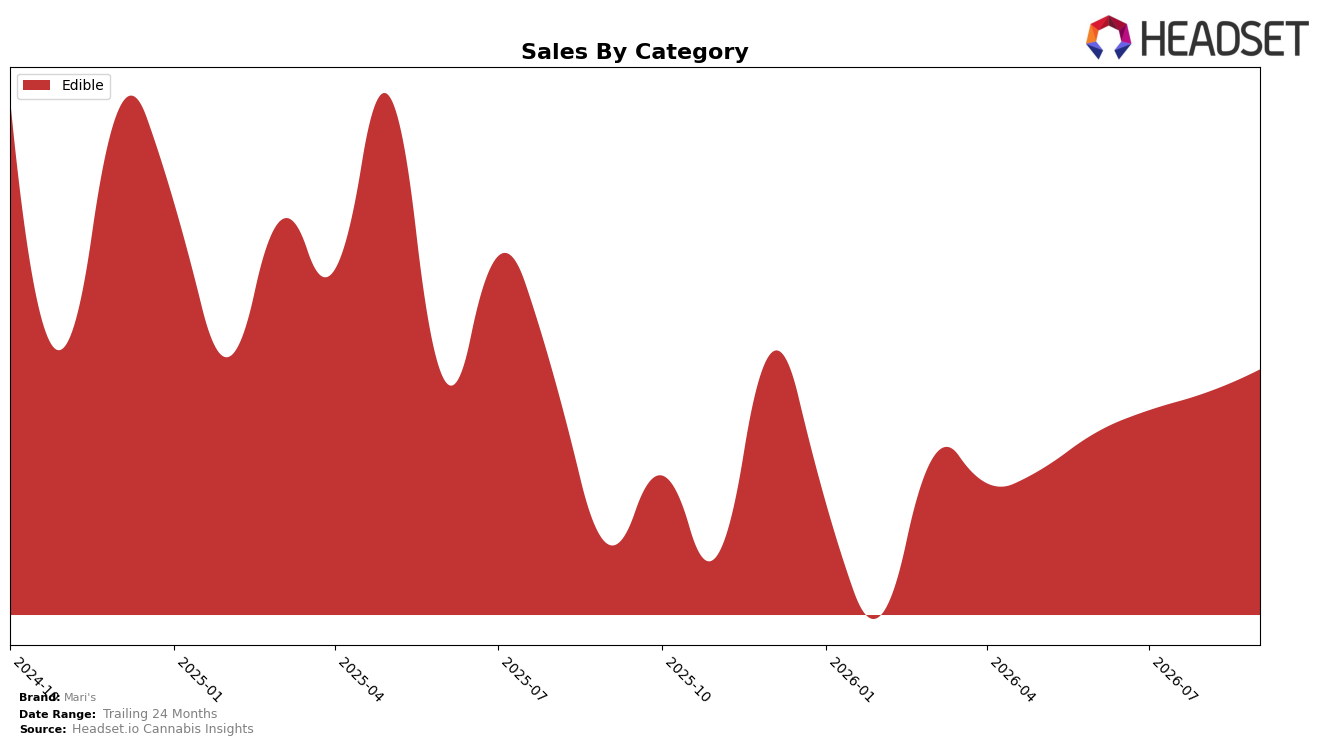
In September 2026, Mari's remained entirely concentrated in Edible, with category share at 100.0% and an Edible rank of 19 in Washington, while average item price rose 3.18% year over year and sales grew 10.80% YoY alongside a 1.34% MoM uptick. The combination of a 100.0% mix and a 19th-place rank implies Mari's is trading category depth for focus; the 10.80% YoY lift versus a 1.34% MoM gain suggests momentum is coming from sustained repeat or distribution stability rather than a one-off spike.
Given an exclusive Edible mix at 100.0% and a 3.18% average price increase alongside 10.80% YoY sales growth, Mari's positioning leans into value elasticity within the Edible segment rather than multi-category diversification. With rank at 19 and MoM growth of 1.34%, the pattern implies headroom is tied to optimizing Edible assortment and price-pack architecture across Washington rather than expanding into adjacent categories in the near term.
Competitive Landscape
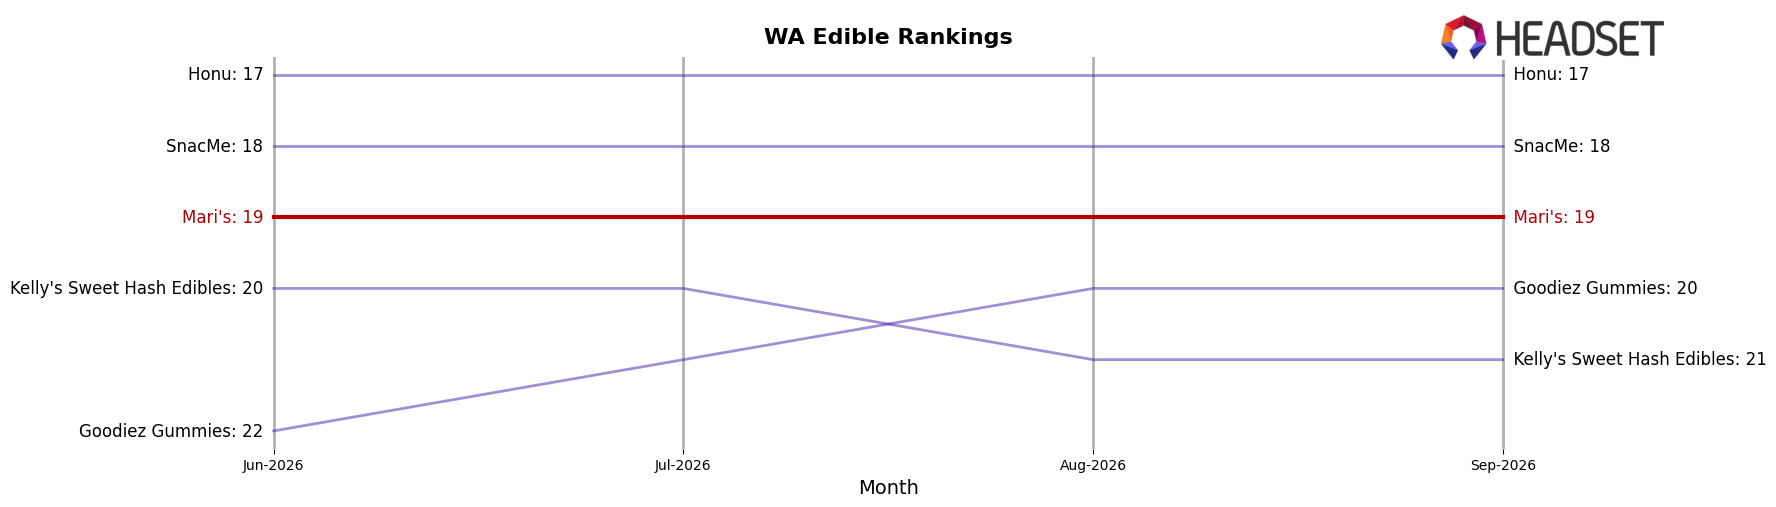
In September 2026, Mari's ranks #19 in WA Edible, down 1 position year over year from #18 and flat versus the last three months at #19, while its historical peak of #16 in September 2024 is 3 spots higher; at the top end, Wyld held #1 year over year with a 6.0% sales lift and Green Revolution stayed at #2 despite a 3.1% sales decline, indicating that leadership stability contrasts with mid-tier stagnation where Mari's sits; with category leaders neither ceding rank nor compressing from above, a one-rank YoY slip alongside a three-rank gap to peak implies Mari's is in a holding pattern that will require share capture from adjacent ranks rather than waiting for top-tier attrition.
Notable Products
Sativa Strawberry Move Mints 40-Pack (100mg) posted the steepest decline in September 2026 at -5.86% MoM while holding rank 4, contrasting with Sativa Wintermint Move Mints 20-Pack (100mg) up 7.96% at rank 2. Category concentration is clear with ten of the top ten SKUs in Edible mints, and the top-ranked Sativa Peppermint Move Mints 20-Pack (100mg) dipped -1.58% despite leading at rank 1 and generating $11,100. This split between modest declines at ranks 1 and 4 and mid-single-digit gains at ranks 2 and 5 implies Mari's is tilting toward refreshing flavor profiles and balanced formulations rather than purely sativa-forward staples.
Top Selling Cannabis Brands






Data for this report comes from real-time sales reporting by participating cannabis retailers via their point-of-sale systems, which are linked up with Headset’s business intelligence software. Headset’s data is very reliable, as it comes digitally direct from our partner retailers. However, the potential does exist for misreporting in the instance of duplicates, incorrectly classified products, inaccurate entry of products into point-of-sale systems, or even simple human error at the point of purchase. Thus, there is a slight margin of error to consider. Brands listed on this page are ranked in the top twenty within the market and product category by total retail sales volume.

