Jun-2026
Sales
Trend
6-Month
Product Count
SKUs
Avg Price
YoY Sales Change
YoY Price Change
Market Insights Snapshot
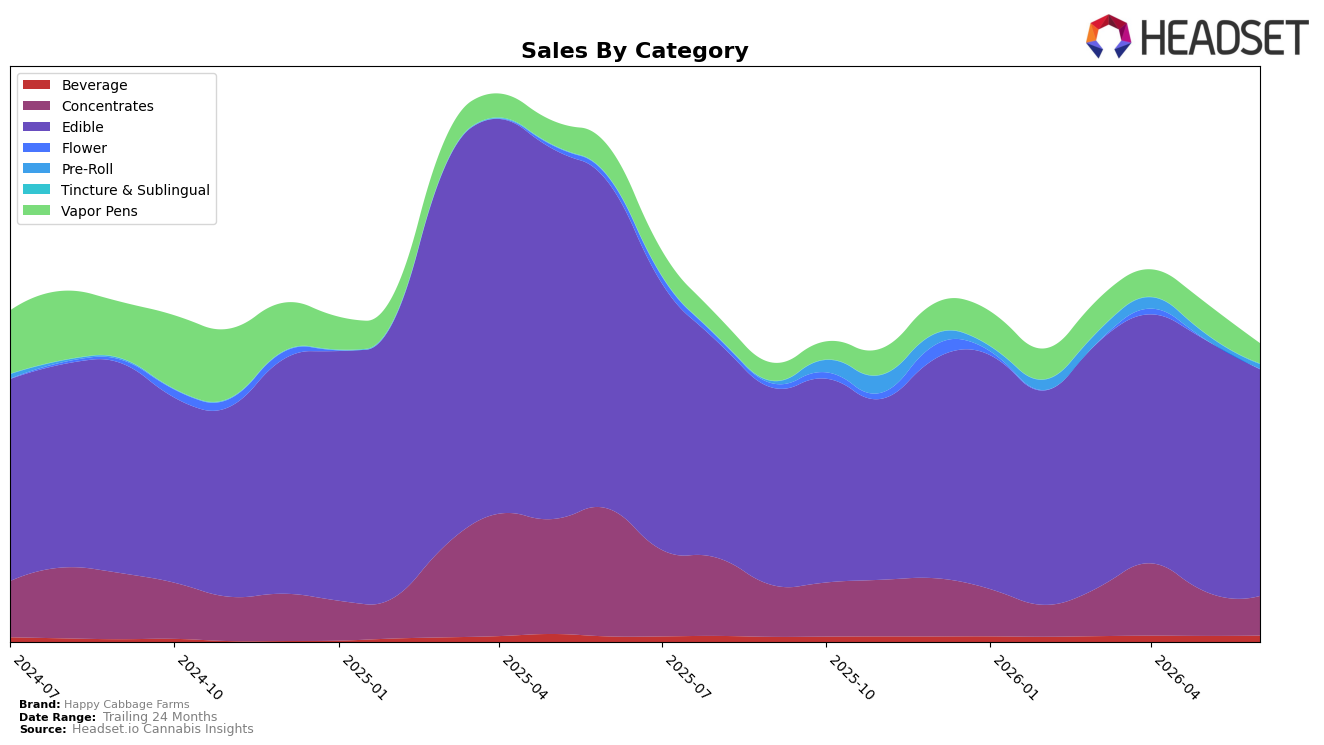
Happy Cabbage Farms concentrated 76.30% of June 2026 sales in Edible, where year-over-year sales fell 30.59% and month-over-month slipped 10.02%, while Vapor Pens, now 6.72% share, declined 33.10% YoY and 34.44% MoM. Concentrates carried 13.24% share but contracted 69.14% YoY and 11.24% MoM, contrasted by Beverage at 2.16% share growing 14.43% YoY and 5.18% MoM; meanwhile, Flower sat at 0.05% share after a 97.20% YoY drop but a 31.25% MoM uptick. With the brand’s overall sales down 39.93% YoY and average price down 35.62% YoY, the category mix skews toward lower-priced Edible while higher-ticket segments retrench, implying revenue pressure from mix shift and price compression.
The tilt toward Edible at 76.30% share alongside a 69.14% YoY contraction in Concentrates and a 33.10% YoY decline in Vapor Pens suggests positioning concentrated in value-accessible formats rather than premium potency segments; the 14.43% YoY and 5.18% MoM growth in Beverage indicates a small but expanding adjacency that could offset some volatility. Holding rank 8 in Edible in Oregon while Edible declines 30.59% YoY and 10.02% MoM signals that relative placement is maintained by depth in one category, but the broad 34.44% MoM slide in Vapor Pens and 11.24% MoM drop in Concentrates point to underexposure in faster-recovering premium channels, implying the brand’s current positioning trades market breadth for category concentration risk.
Competitive Landscape
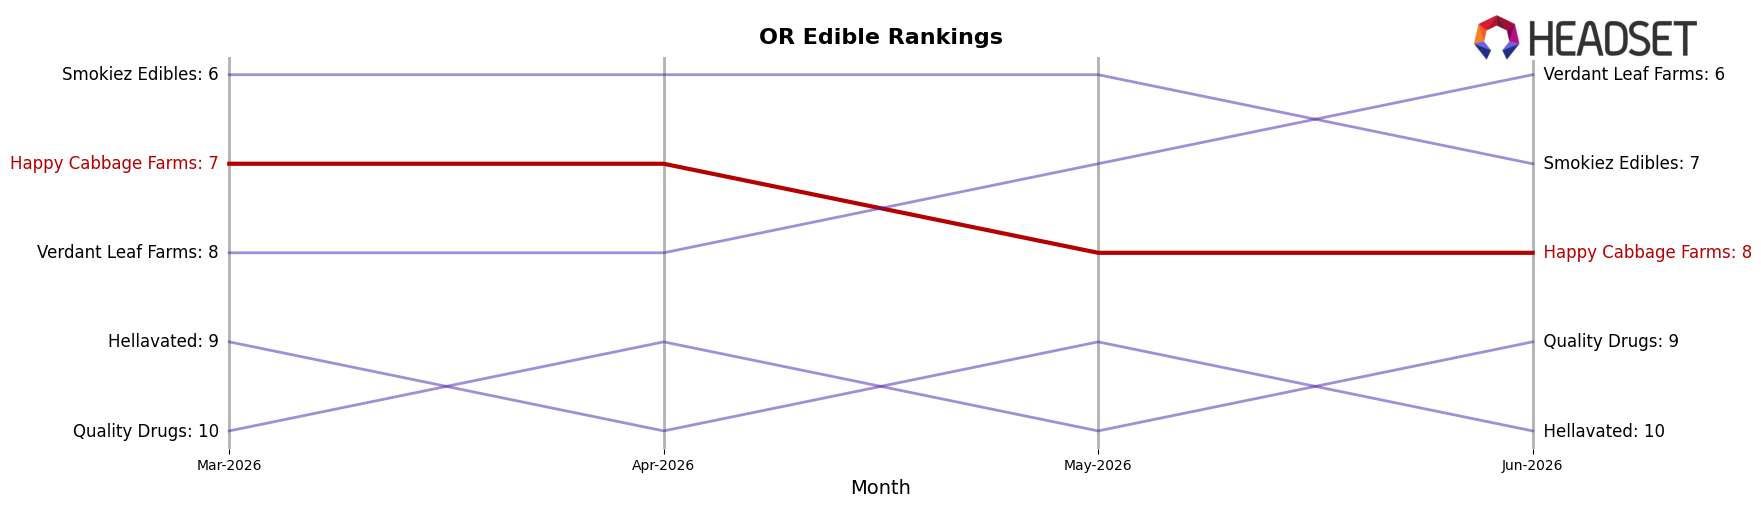
Happy Cabbage Farms is ranked #8 in OR Edible in June 2026, down 1 position from #7 year over year, and flat versus March 2026 at #7 to #8, while its peak rank of #7 in April 2026 marks a 1-place slide since that month; in contrast, Wyld held #1 year over year and in June 2026 with approximately +45% YoY sales growth, and Gron / Grön stayed at #2 while posting about -105% YoY sales change, indicating volatility above Happy Cabbage Farms even as Good Tide maintained #4 with roughly +89% YoY growth and Mule Extracts remained #5 amid about -12% YoY decline; the pattern implies Happy Cabbage Farms’ slight rank erosion from #7 to #8 is more about being outpaced by faster growers than broad market contraction, suggesting share defense will hinge on capturing upside in segments lifted by competitors with +45% to +89% gains rather than chasing peers with double-digit declines.
Notable Products
Blox - Indica Marionberry Solventless Ice Hash Gummy (100mg) posted the steepest decline at -31.8% while dropping to rank 7, and Blox - CBN/THC 1:1 Slumber Berry Solventless Rosin Gummies 10-Pack (100mg CBN, 100mg THC) fell -20.3% at rank 6. At the top, Blox - Green Apple Solventless Hash Gummy (100mg) held rank 1 with -3.7% MoM as Blox - Midnight Melons Hash Rosin Gummies 10-Pack (100mg) slid -10.6% at rank 2. With all ten top SKUs concentrated in Edibles and mixed minor gains like +0.7% at rank 3 overshadowed by multiple double‑digit declines, the pattern implies portfolio momentum is tilting away from breadth toward defending a few flagship gummies.
CBD/THC 1:1 Strawberry Serenity Solventless Rosin Gummies 10-Pack (100mg CBD, 100mg THC) grew +9.6% at rank 4, contrasting with Cherry Limeade’s -19.0% at rank 5. Eight of the top nine SKUs posted negative or flat MoM, and only one SKU shows a positive move under +10%, indicating June 2026 demand consolidated around incumbents rather than new flavors despite a top-line near $29,943 for the leader. This mix implies Happy Cabbage Farms will need targeted flavor rationalization and pack-size incentives to stabilize mid-tier ranks while protecting the premium solventless halo.
Top Selling Cannabis Brands
Data for this report comes from real-time sales reporting by participating cannabis retailers via their point-of-sale systems, which are linked up with Headset’s business intelligence software. Headset’s data is very reliable, as it comes digitally direct from our partner retailers. However, the potential does exist for misreporting in the instance of duplicates, incorrectly classified products, inaccurate entry of products into point-of-sale systems, or even simple human error at the point of purchase. Thus, there is a slight margin of error to consider. Brands listed on this page are ranked in the top twenty within the market and product category by total retail sales volume.

