Market Insights Snapshot
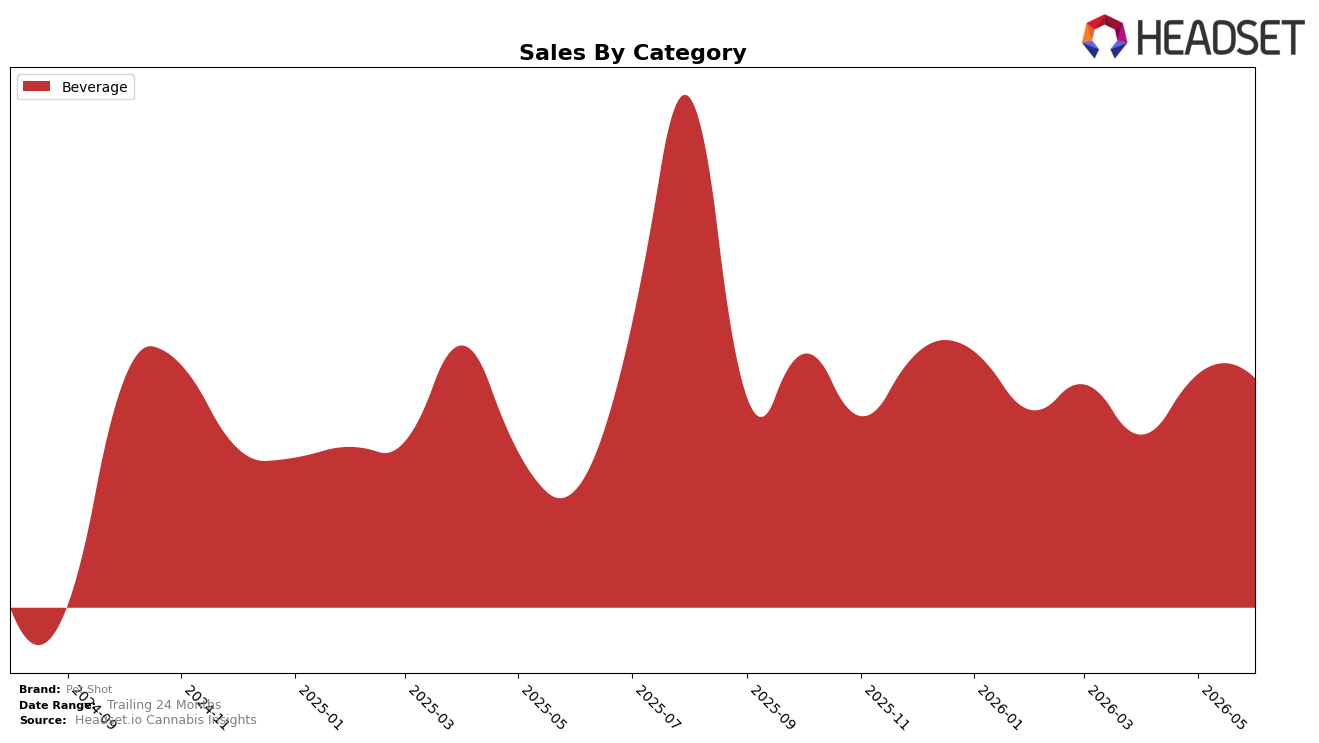
In June 2026, Pot Shot’s mix is fully concentrated in Beverage at 100.0% share, with category sales up 92.43% year over year and down 1.79% month over month. Average price in Beverage is $7.85 with a 9.97% YoY decrease, while the category rank in Michigan sits at 7, indicating a higher-tier placement despite the MoM dip. The pattern implies Pot Shot is trading price for velocity within Beverage, using a lower unit price alongside near-doubling YoY sales to consolidate a single-category focus.
The shift toward lower price points alongside a 92.43% YoY sales gain and a 1.79% MoM contraction suggests Pot Shot is positioned as a value-leaning Beverage option that can maintain rank 7 in Michigan while absorbing short-term variability. With Beverage holding 100.0% of the brand’s mix and price down 9.97% YoY, the strategy implies headroom to defend or climb from rank 7 by prioritizing unit throughput over margin in the near term.
Competitive Landscape
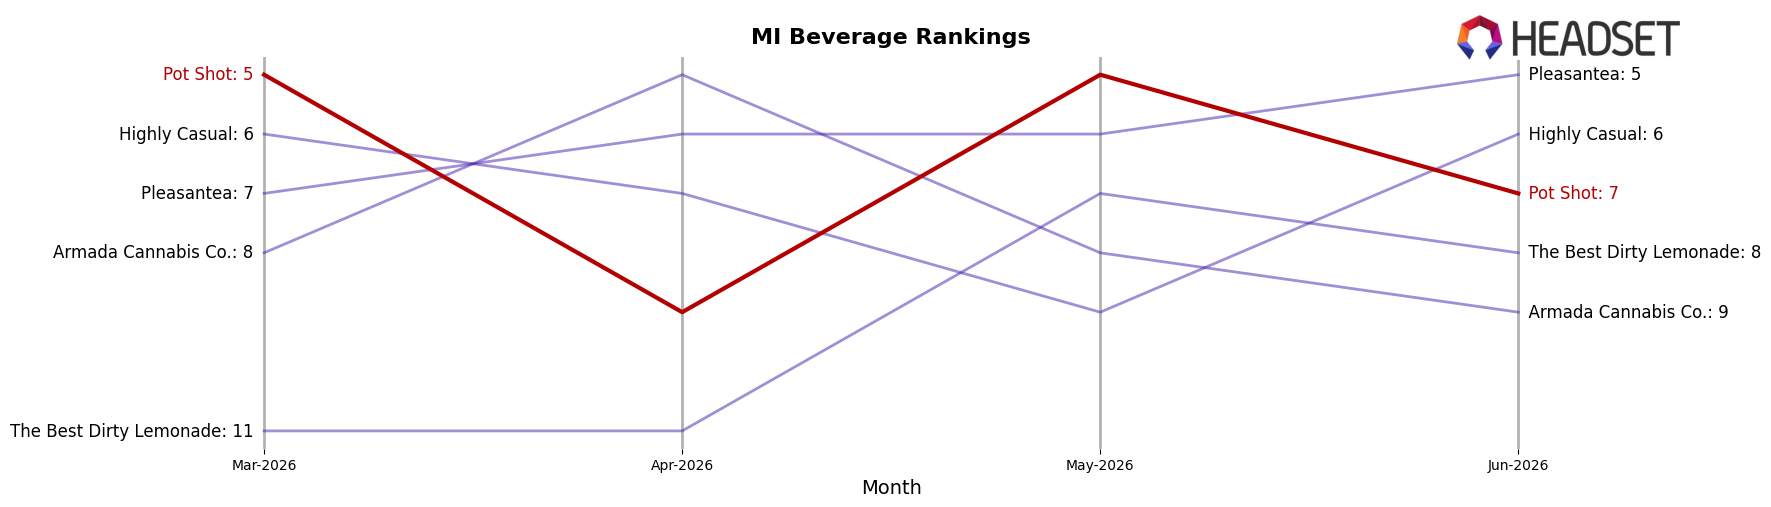
Pot Shot sits at #7 in MI Beverage in June 2026, improving 2 ranks YoY from #9 and slipping 2 places since March 2026 from #5, indicating mid-pack volatility as rivals accelerate. Mary Jones advanced from #2 to #1 while growing sales 22.2%, and Keef Cola fell from #1 to #2 with a 10.5% sales decline, suggesting the top tier is rotating rather than expanding. Meanwhile, CQ (Cannabis Quencher) climbed from #7 to #3 with 138.0% YoY sales growth and Chill Medicated rose from #8 to #4 with 177.3% YoY growth, both outpacing Pot Shot’s trajectory from a January 2026 peak at #3 to its current #7. The pattern implies Pot Shot’s rank trajectory is flattening as faster-rising challengers compress its share of upper-tier slots, requiring a pivot toward regaining momentum against brands registering triple-digit growth.
Notable Products
Warped Watermelon Shot (100mg THC, 2oz) posted the steepest movement in June 2026 at -17.6% MoM, slipping to rank 3 while Martian Mango Shot (100mg, 2oz, 50ml) held rank 1 despite a -4.7% decline. Blasted Berry Shot (100mg, 2oz, 50ml) inched up 4.4% MoM at rank 2, whereas Lunar Lime Shot (100mg THC, 2oz) jumped 18.3% MoM at rank 4, putting two SKUs on negative trajectories and two on positive ones. All four top-10 positions are concentrated in Beverage, and Martian Mango Shot (100mg, 2oz, 50ml) generated $35,022 alongside category peers that split between growth and contraction. The pattern implies Pot Shot’s commercial direction hinges on stabilizing the leading Beverage flagship while rotating promotional focus to faster-rising flavors to prevent share leakage from the mid-tier ranks.
Top Selling Cannabis Brands
Data for this report comes from real-time sales reporting by participating cannabis retailers via their point-of-sale systems, which are linked up with Headset’s business intelligence software. Headset’s data is very reliable, as it comes digitally direct from our partner retailers. However, the potential does exist for misreporting in the instance of duplicates, incorrectly classified products, inaccurate entry of products into point-of-sale systems, or even simple human error at the point of purchase. Thus, there is a slight margin of error to consider. Brands listed on this page are ranked in the top twenty within the market and product category by total retail sales volume.

