.svg)

Sep-2026
Sales
Trend
6-Month
Product Count
SKUs
Avg Price
YoY Sales Change
YoY Price Change


Where to Buy
Master Makers is stocked at 78 licensed dispensaries across California, with the deepest coverage in San Diego, Sacramento, San Francisco, San Jose, and Farmersville. Search by ZIP code or city below to find the closest one, or filter by product type if you are after a specific format.
Market Insights Snapshot
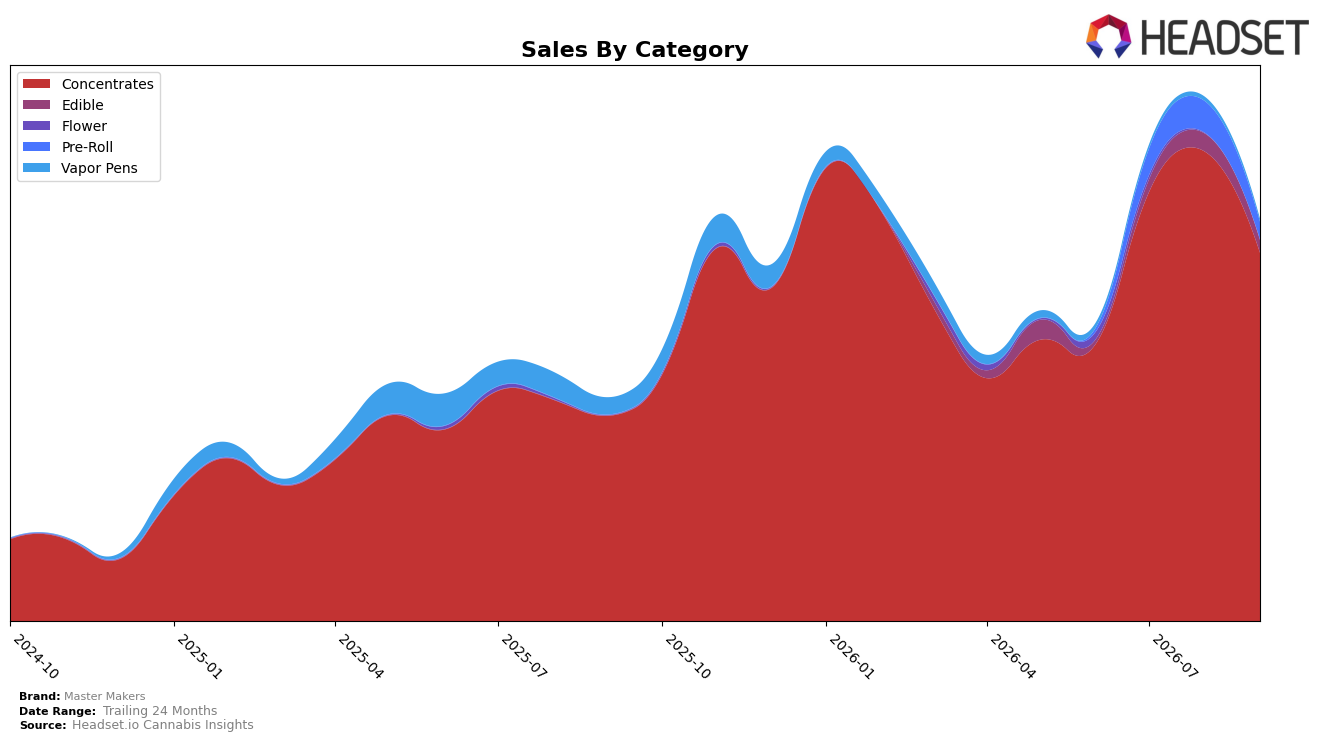
Master Makers concentrated its sales mix in Concentrates at 91.91% share with a year-over-year change of 79.46% and a month-over-month decline of 21.59%, while Vapor Pens fell 83.93% year over year to just 0.67% share with a 31.55% month-over-month slide. Pre-Roll and Edible accounted for 4.33% and 3.08% share, respectively, with month-over-month declines of 44.52% and 29.88%, and the brand’s overall average price moved down 4.79% year over year as September 2026 sales grew 80.51% year over year. The pattern implies a heavy dependence on Concentrates for growth despite broad month-over-month pullbacks across smaller categories, signaling a volume-driven September 2026 anchored in one category rather than a diversified upswing.
Within California Concentrates, Master Makers held rank 18 while Concentrates’ 91.91% share carried the brand’s September 2026 trajectory, indicating its positioning is mid-pack in the state’s core category even as Vapor Pens contracted 83.93% year over year and Pre-Roll shrank 44.52% month over month. With the top category down 21.59% month over month and the brand’s average price 4.79% lower year over year, the mix shift points to a strategy where maintaining or improving rank 18 in Concentrates is the immediate lever, while secondary categories require selective reinvestment to prevent further erosion of presence and price power.
Competitive Landscape
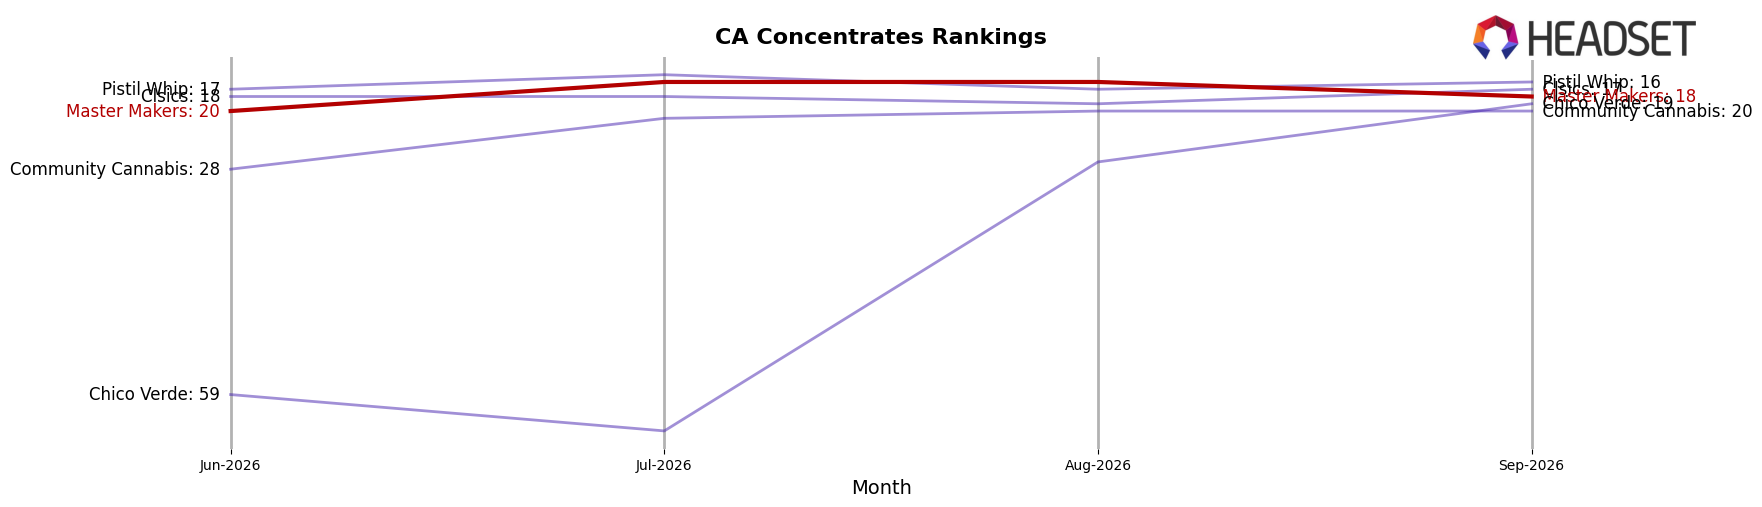
Master Makers ranks #18 in CA Concentrates in September 2026, improving 6 positions from #24 year over year and edging up 2 spots from #20 since June 2026; however, it remains 4 places below its February 2026 peak at #14 and trails the top tier where Raw Garden holds #1 with 9.4% YoY sales growth while 710 Labs advanced from #4 to #2 with 32.7% YoY growth, indicating that Master Makers’ mid-pack climb is slower than leaders expanding share and faster than Punch Extracts / Punch Edibles sliding from #3 to #4 with a 7.7% YoY decline; the pattern implies Master Makers is consolidating into the top-20 but must accelerate gains to break back toward its February 2026 peak as competitors either widen leads or cede ground.
Notable Products
Motor Breath x Banana Punch Full Spectrum Cold Cure Live Rosin (1g) posted the steepest movement in September 2026 with a -42.1% month-over-month drop while holding rank 2, contrasting with GMO Full Spectrum Live Rosin (1g) at rank 1 down -29.0%. Fruit Smack Full Spectrum Rosin (1g) rose +45.5% MoM at rank 3, and Edible entry Blue Raspberry Gummies 10-Pack (100mg) climbed +30.5% at rank 5 with roughly $4.6K in sales. Seven of the top ten are Concentrates, indicating category concentration even as one leader contracts double-digits and another surges near +50%. The mix points to Master Makers leaning into a concentrates-led portfolio where volatility within flagship SKUs is shaping near-term allocation and promo timing.
Top Selling Cannabis Brands






Data for this report comes from real-time sales reporting by participating cannabis retailers via their point-of-sale systems, which are linked up with Headset’s business intelligence software. Headset’s data is very reliable, as it comes digitally direct from our partner retailers. However, the potential does exist for misreporting in the instance of duplicates, incorrectly classified products, inaccurate entry of products into point-of-sale systems, or even simple human error at the point of purchase. Thus, there is a slight margin of error to consider. Brands listed on this page are ranked in the top twenty within the market and product category by total retail sales volume.

