May-2026
Sales
Trend
6-Month
Product Count
SKUs
Avg Price
YoY Sales Change
YoY Price Change
Market Insights Snapshot
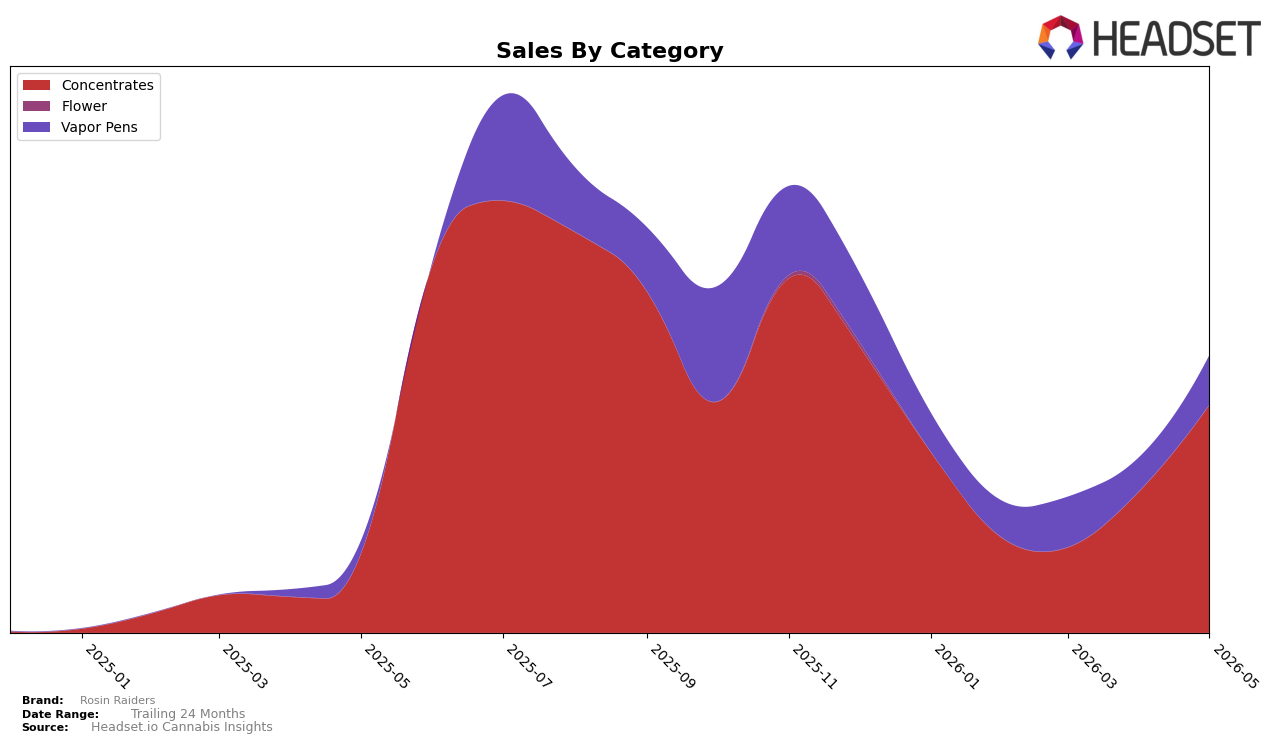
In May 2026, Rosin Raiders concentrated 82.19% of sales in Concentrates and 17.81% in Vapor Pens, with Concentrates ranking 19th in Oregon and expanding 60.81% month over month versus a 45.86% MoM gain in Vapor Pens. Year over year, Vapor Pens rose 292.62% while Concentrates increased 189.01%, coinciding with a 40.12% YoY drop in average price to $24.94; this split implies the brand is leaning into price-accessible formats while still anchored in its core category.
The mix tilt suggests share consolidation in the core while using Vapor Pens as a growth wedge: Concentrates’ 82.19% share paired with a 60.81% MoM lift supports near-term rank stability around 19th in Oregon, while the 17.81% share from Vapor Pens and its 292.62% YoY surge increase exposure to faster-turn occasions. With both categories priced tightly around $24.86–$24.95 and overall average price down 40.12% YoY, the pattern implies a deliberate volume-first posture that trades margin for scale, positioning Rosin Raiders to capture incremental trips without diluting its Concentrates identity.
Competitive Landscape
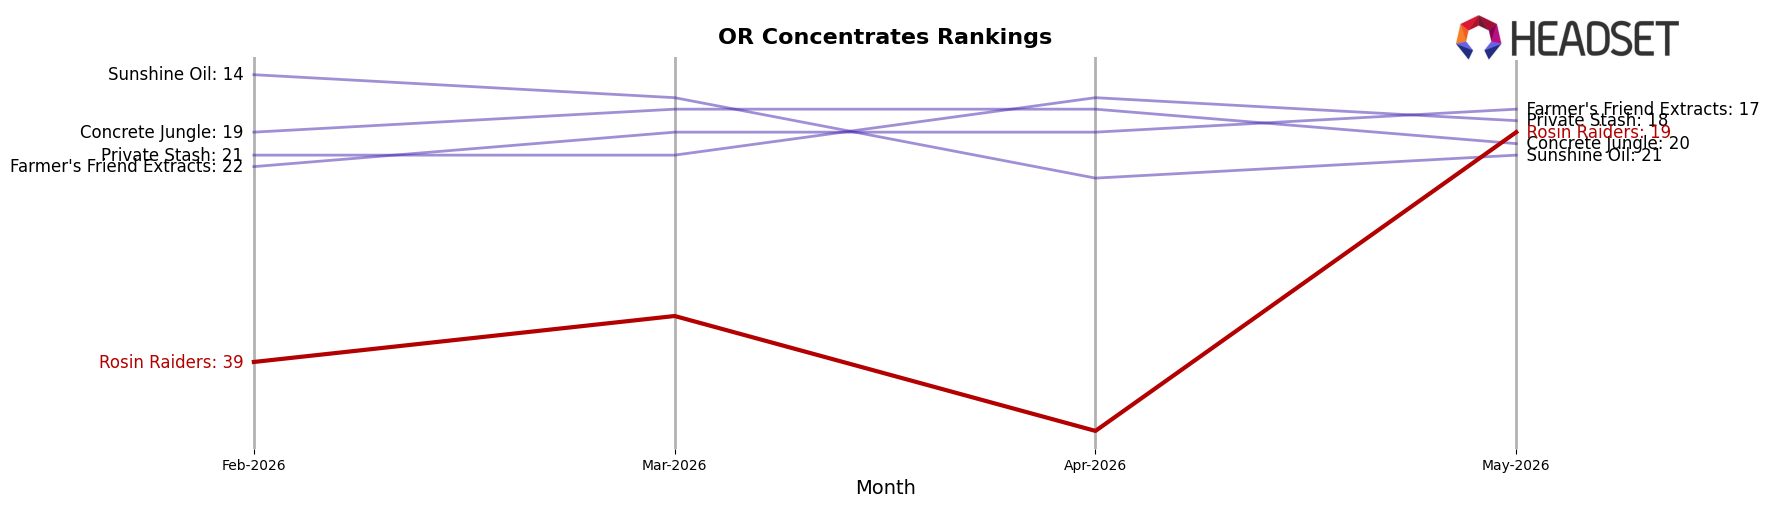
Rosin Raiders sits at rank #19 in OR Concentrates in May 2026, climbing 55 positions from #74 year over year, and improving 20 ranks from #39 three months ago; this is also a new peak at #19 in May 2026, indicating a step-change rather than a blip. In contrast, Altered Alchemy held at #1 year over year with a 22.3% sales increase while Red Eye Extracts (OR) slipped from #2 to #4 alongside a 38.5% sales decline, and Buddies advanced from #11 to #5 with 64.2% growth; this mixture of stability at the top and churn below implies Rosin Raiders is moving into the mid-tier by capturing share from declining incumbents rather than displacing the leaders.
Notable Products
Lemon Hashburger Rosin Cartridge (1g) posted the largest movement in May 2026 with a +134% month-over-month surge and climbed into rank 6, while Fruit Storm Rosin Cartridge (1g) also accelerated at +66% MoM and held rank 9. Guava Stardog Rosin Cartridge (1g) added +12% MoM at rank 8, and five of the top ten SKUs are Concentrates clustered in ranks 1 through 5, indicating a high Concentrates concentration alongside a rising Vapor Pens trio in ranks 6–9. With Concentrates dominating the top-five ranks and Vapor Pens delivering triple- and double-digit MoM gains, the mix points to Rosin Raiders tilting incremental growth toward Vapor Pens while defending share in Concentrates.
Top Selling Cannabis Brands
Data for this report comes from real-time sales reporting by participating cannabis retailers via their point-of-sale systems, which are linked up with Headset’s business intelligence software. Headset’s data is very reliable, as it comes digitally direct from our partner retailers. However, the potential does exist for misreporting in the instance of duplicates, incorrectly classified products, inaccurate entry of products into point-of-sale systems, or even simple human error at the point of purchase. Thus, there is a slight margin of error to consider. Brands listed on this page are ranked in the top twenty within the market and product category by total retail sales volume.

