.svg)

Aug-2026
Sales
Trend
6-Month
Product Count
SKUs
Avg Price
YoY Sales Change
YoY Price Change


Where to Buy
Mile High Dabs is stocked at 28 licensed dispensaries across Colorado, with the deepest coverage in Denver, Durango, Colorado Springs, Pueblo West, and Thornton. Search by ZIP code or city below to find the closest one.
Market Insights Snapshot
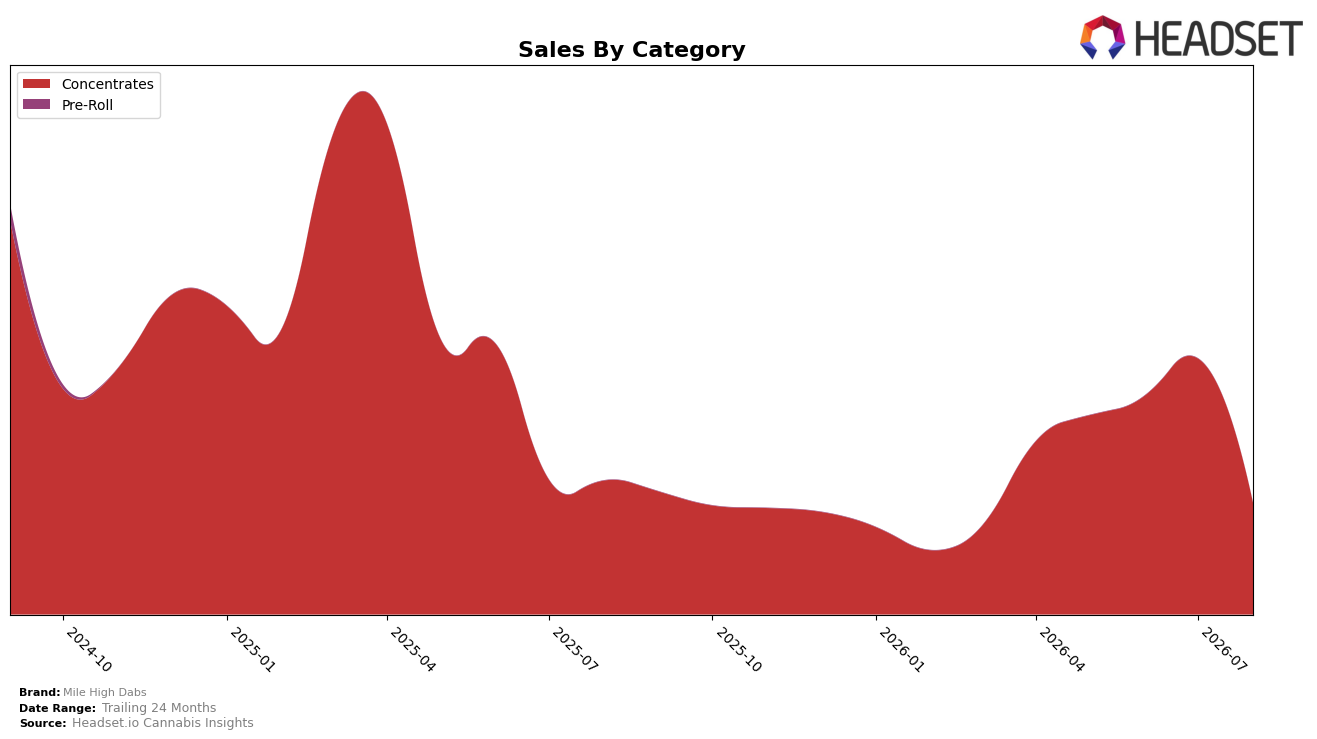
In August 2026, Mile High Dabs operated as a single-category brand with Concentrates accounting for 100% category share, while category sales declined 16.8% year over year and 56.5% month over month. Average item price rose 51.8% YoY to $17.32, even as overall brand sales fell 16.8% YoY, indicating volume contraction against price inflation within Concentrates. With the brand ranked 39 in Concentrates in Colorado, the combination of a steep MoM pullback and elevated pricing implies a price-led strategy that reduced unit throughput and compressed rank momentum.
The exclusive focus on Concentrates at 100% share, together with a 56.5% MoM decline and 39th rank in Colorado, signals concentration risk: price sensitivity in this category likely amplified volume loss when prices rose 51.8% YoY. Given a 16.8% YoY sales decline alongside higher average price, the pattern points to an elastic demand curve where unit demand eroded faster than price gains could stabilize sales; sustaining or improving rank will require either moderated pricing or mix diversification within Concentrates (e.g., formats or potency tiers) to recapture price-sensitive buyers.
Competitive Landscape
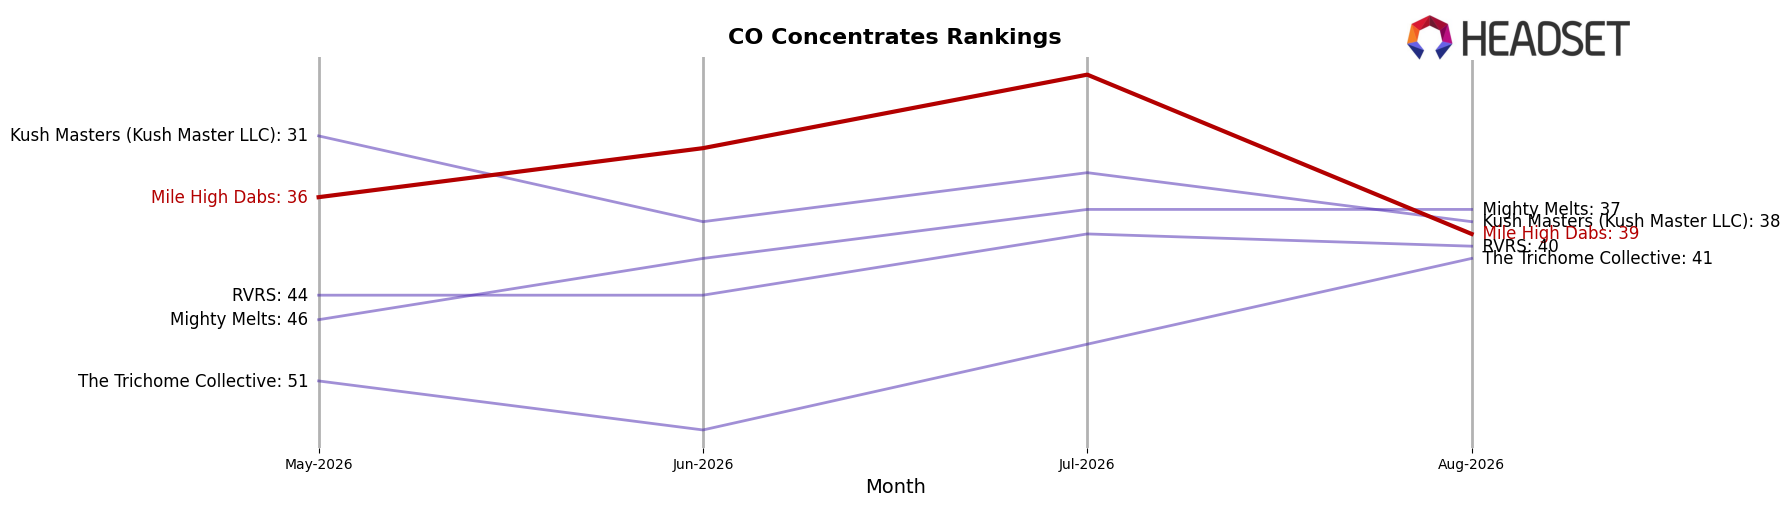
Mile High Dabs sits at rank #39 in CO Concentrates in August 2026, a 1-position improvement from #40 year over year, but down 3 spots from #36 three months prior; this contrasts with Amber moving from #2 to #1 and 710 Labs sliding from #1 to #3, indicating the top tier is rotating while Mile High Dabs remains mid-pack. Despite a historical peak at #21 in March 2025, the current #39 placement alongside competitors like Nomad Extracts rising from #3 to #2 and Sunshine Extracts climbing from #7 to #4 suggests market share is consolidating upward, implying Mile High Dabs’ trajectory is stabilizing below prior highs and will require a rank inflection to re-enter the top 25.
Notable Products
Sour Clementine Wax (1g) led the month’s movement with a -65.96% month-over-month decline while sitting at rank 6, and L.A. Baker Sugar Wax (1g) slipped -12.73% yet held rank 1. Three SKUs are tied between ranks 6 and 7, indicating compression in the middle of the leaderboard and suggesting price-sensitive churn clustered below the top two.
Illemonati Sugar (1g) entered at rank 2 with no prior month baseline, while Clementine Daze Sugar Wax (1g) debuted at rank 3, concentrating new momentum at the top even as L.A. Baker Sugar Wax (1g) contracted -12.73%. Four-gram formats occupy at least three top-7 positions, and Devil Driver Sugar Wax (4g) posted $2,279 at rank 6, implying mix-shift headroom toward value-size packs even as single-gram volatility rises.
Across the top ten, concentrates dominate 100% of placements and at least three Sugar or Wax variants share the 6–7 rank band, pointing to intra-format cannibalization amid price tiers. The pattern implies Mile High Dabs is pivoting toward multi-gram value to stabilize rank despite sharper month-over-month swings in single-gram SKUs.
Top Selling Cannabis Brands






Data for this report comes from real-time sales reporting by participating cannabis retailers via their point-of-sale systems, which are linked up with Headset’s business intelligence software. Headset’s data is very reliable, as it comes digitally direct from our partner retailers. However, the potential does exist for misreporting in the instance of duplicates, incorrectly classified products, inaccurate entry of products into point-of-sale systems, or even simple human error at the point of purchase. Thus, there is a slight margin of error to consider. Brands listed on this page are ranked in the top twenty within the market and product category by total retail sales volume.

