Market Insights Snapshot
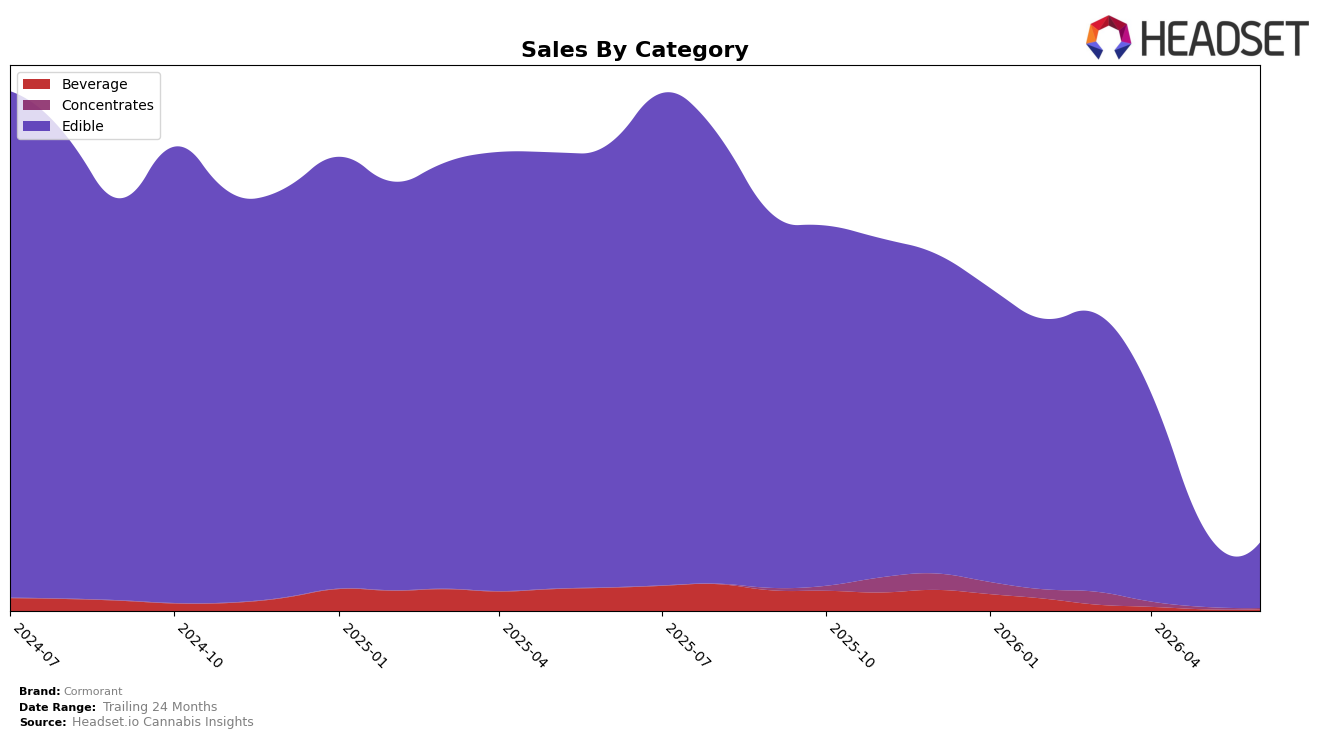
Cormorant concentrated 97.01% of sales in Edible during June 2026 while Beverage held 1.78% and Concentrates 1.21%, indicating a narrowed mix as Edible fell 15.56% month over month and 85.30% year over year, versus Beverage up 0.53% MoM but down 94.74% YoY. The brand’s average price rose 19.82% YoY to $6.39 as Edible pricing sat at $6.36 and Beverage at $5.55, while Concentrates declined 57.23% MoM without a year-over-year baseline. The pattern implies volume contraction is concentrated in Edible despite price elevation, and minimal but positive MoM movement in Beverage signals a small stabilizer that is currently too small to offset the Edible-driven pullback.
With Edible at a 97.01% share and rank 26 in Washington Edibles, the double tension of an 85.30% YoY sales drop and a 19.82% YoY price lift points to demand elasticity eroding unit throughput, while Beverage’s 0.53% MoM uptick and Concentrates’ 57.23% MoM decline show peripheral categories are volatile and not yet scaled. This mix concentration combined with rank 26 implies Cormorant is over-indexed to a price-sensitive segment, and near-term positioning requires either reclaiming Edible velocity at the current $6.39 price point or reallocating assortment to the small but more stable Beverage niche to diversify risk.
Competitive Landscape
Cormorant sits at rank #26 in WA Edible in June 2026, down 16 positions from its peak of #10 in September 2025 and 16 places below its March 2026 position of #13, while year over year it is also 16 ranks behind its June 2025 level of #10; in contrast, Wyld held #1 year over year with a 7.25% sales lift and Hot Sugar stayed at #3 despite a -1.85% sales change, indicating that Cormorant’s slide from #13 to #26 alongside competitors maintaining top-5 stability implies a loss of relative shelf presence that will likely persist without a targeted recovery move.

Notable Products
CBD/THC 1:1 Mango Sorbet (100mg CBD, 100mg THC, 4oz) posted the largest month-over-month surge at +59.7% and took rank 1, while Tangerine Sorbet Frozen (100mg THC, 4oz) fell -28.4% to rank 4. Blueberry Sorbet (100mg THC, 4oz) declined -31.5% at rank 6, and Cherry Lemonade Sorbet (100mg THC, 4oz) slid -10.6% at rank 5. With nine of the top ten being Edible sorbets and the only dollar outlier at $9,355 attached to the 1:1 leader, the skew toward a single fast-rising 1:1 SKU alongside multiple double-digit THC-only declines implies Cormorant is tilting its product mix toward balanced formulations to stabilize share at the top while pruning underperforming flavors.
Top Selling Cannabis Brands
Data for this report comes from real-time sales reporting by participating cannabis retailers via their point-of-sale systems, which are linked up with Headset’s business intelligence software. Headset’s data is very reliable, as it comes digitally direct from our partner retailers. However, the potential does exist for misreporting in the instance of duplicates, incorrectly classified products, inaccurate entry of products into point-of-sale systems, or even simple human error at the point of purchase. Thus, there is a slight margin of error to consider. Brands listed on this page are ranked in the top twenty within the market and product category by total retail sales volume.

