.svg)
Sep-2026
Sales
Trend
6-Month
Product Count
SKUs
Avg Price
YoY Sales Change
YoY Price Change


Where to Buy
Sparq Cannabis Company is stocked at 63 licensed dispensaries across Massachusetts, with the deepest coverage in Boston, Worcester, Brockton, Cambridge, and Lynn. Search by ZIP code or city below to find the closest one, or filter by product type if you are after a specific format.
Market Insights Snapshot
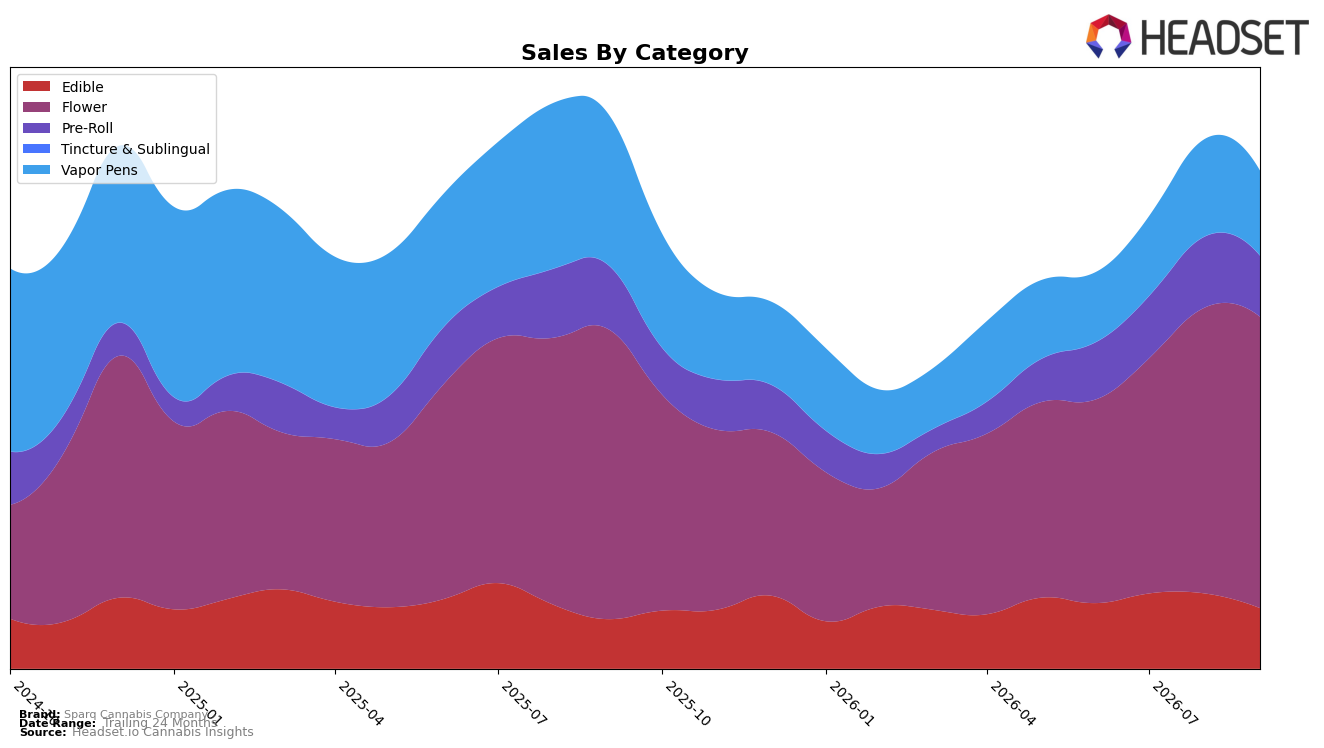
In September 2026, Sparq Cannabis Company concentrated 58.58% of sales in Flower, which inched up 0.46% year over year and 1.95% month over month, while Vapor Pens fell 43.90% YoY and 12.87% MoM to 17.03% share. Pre-Roll slipped 4.66% YoY and 14.03% MoM to 12.22% share, contrasted by Edible rising 22.31% YoY but dropping 19.54% MoM to 12.17% share. Average price declined 22.90% YoY to $16.66, with Flower’s $24.06 and Pre-Roll’s $7.80 anchoring a lower-priced mix shift; paired with a brand-level sales change of -10.26% YoY and +6.48% over 24 months, the pattern implies reliance on Flower stability to buffer acute MoM contractions in Edible and Pre-Roll while Vapor Pens remains a drag.
Sparq Cannabis Company’s heavier tilt to Flower, combined with a 23rd rank in Flower in Massachusetts and a 1.95% MoM gain in that category, indicates a defensive posture: letting Flower’s steadier volumes offset a 19.54% MoM setback in Edible and a 14.03% MoM pullback in Pre-Roll. With Vapor Pens down 43.90% YoY and 12.87% MoM, and the brand’s average price down 22.90% YoY, the mix suggests price-led customer retention rather than premium expansion; the implication is to consolidate around Flower’s 58.58% share while selectively rebuilding Edible’s 22.31% YoY momentum to counterbalance the shrinking pen franchise.
Competitive Landscape
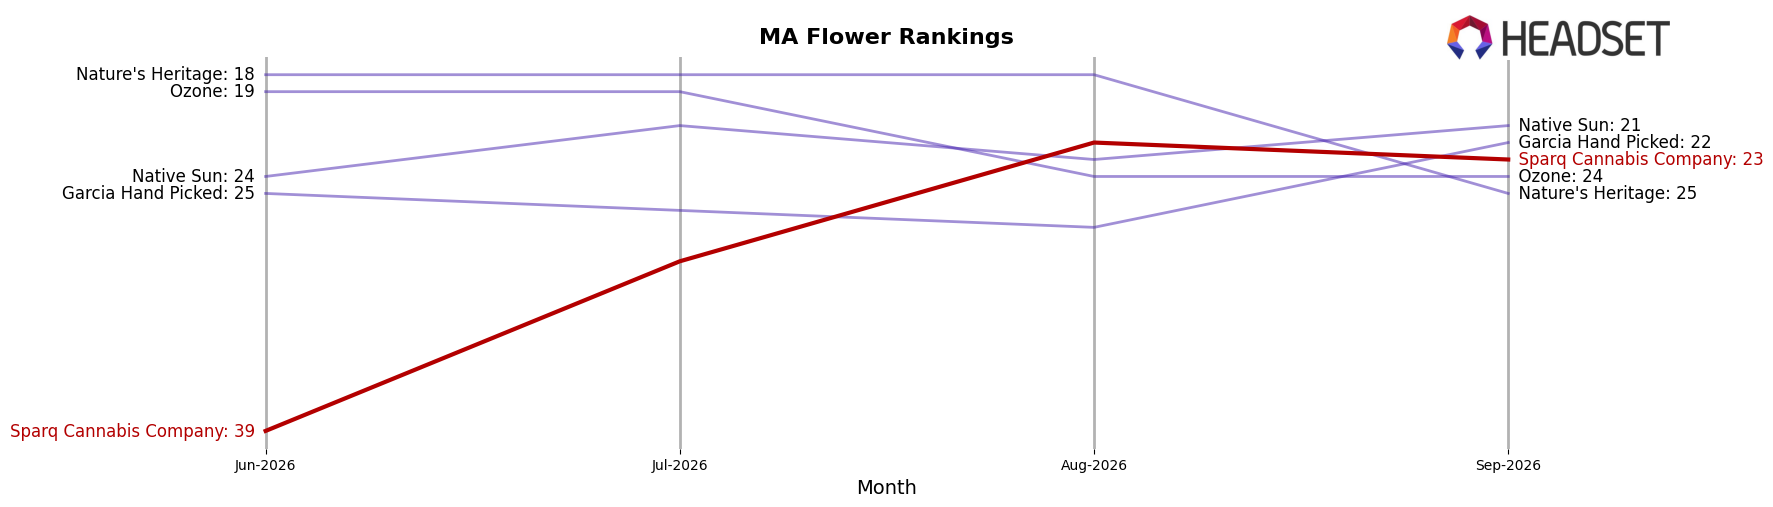
Sparq Cannabis Company sits at rank #23 in MA Flower in September 2026 after a 1-place YoY improvement from #24, and a 16-position climb from #39 in June 2026, while its peak at #22 in August 2026 was a 1-rank better mark than the current level; against this backdrop, Perpetual Harvest advanced from #4 to #1 with 124.1% YoY sales growth and Simply Herb slipped from #1 to #3 alongside a -16.6% YoY sales change, indicating that Sparq’s modest rank gain amid sharper upswings and declines at the top implies a trajectory driven more by steady share retention than breakout momentum.
Notable Products
Warheads Pre-Roll (1g) posted the standout move in September 2026 with a 69.1% month-over-month gain while climbing into rank 3, contrasting with Blue Watermelon Fast Acting Gummies 20-Pack (100mg) dropping 17.6% MoM at rank 5. Pink Runtz (1g) slipped 7.5% MoM at rank 1 as Pink Runtz (3.5g) advanced 30.4% MoM at rank 2, and three Flower SKUs sat inside the top 10, concentrating share in inhalables. With two Pre-Roll SKUs in the top six and edibles mixed—one down 17.6% and another up 15.6% at rank 10—the basket is tilting toward faster-turn inhalables, implying Sparq Cannabis Company is leaning into formats that convert traffic quickly and support near-term velocity.
Top Selling Cannabis Brands






Data for this report comes from real-time sales reporting by participating cannabis retailers via their point-of-sale systems, which are linked up with Headset’s business intelligence software. Headset’s data is very reliable, as it comes digitally direct from our partner retailers. However, the potential does exist for misreporting in the instance of duplicates, incorrectly classified products, inaccurate entry of products into point-of-sale systems, or even simple human error at the point of purchase. Thus, there is a slight margin of error to consider. Brands listed on this page are ranked in the top twenty within the market and product category by total retail sales volume.

