.svg)


Market Insights Snapshot
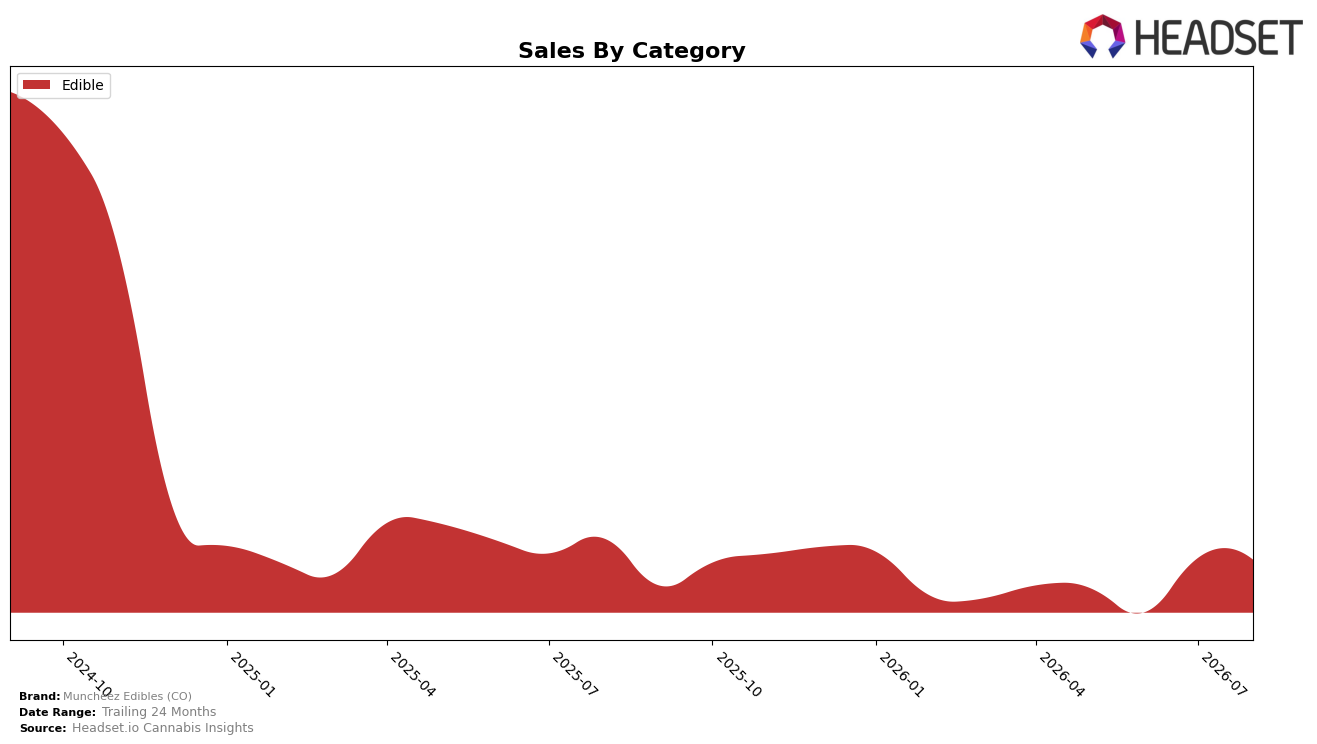
In August 2026, Muncheez Edibles (CO) operated as a single-category brand with Edible at 100.0% category share, posting year-over-year sales down 15.85% and month-over-month down 1.50%. Within Colorado Edibles, the brand held rank 33, while the average price fell 12.07% year-over-year to $13.67 and edged down alongside the 1.50% monthly sales dip. The combined effect of a full Edible concentration and rank 33 in state-category context indicates a narrow portfolio that is not offsetting August 2026 demand softness with mix diversification, implying that reliance on Edibles alone is suppressing recovery potential.
The 12.07% price reduction paired with a 15.85% annual sales decline suggests price cuts did not translate into proportional volume gains, and the 1.50% monthly contraction alongside an unchanged 100.0% Edible mix indicates limited tactical levers in August 2026. Sitting at rank 33 in Colorado Edibles while concentrating entirely in one category implies that future share movement will hinge more on product-line depth and pricing architecture within Edibles than on cross-category expansion, positioning Muncheez Edibles (CO) as a value-sensitive player whose demand elasticity did not offset aggregate category headwinds in the month.
Competitive Landscape
Muncheez Edibles (CO) sits at rank #33 in CO Edible for August 2026, improving 6 spots from #39 year over year, while slipping 1 position from #34 in May 2026; the brand’s historical ceiling of #24 in September 2024 frames the current standing as mid-pack with room to recover. Against market leaders, Wyld held #1 year over year but faced a 29.0% YoY sales decline, whereas Dialed In Gummies advanced from #3 to #2 with a 29.7% YoY increase, indicating that rank mobility is achievable despite category headwinds. The mix of a 6-rank annual gain and a 1-rank quarterly slip implies Muncheez Edibles (CO) is stabilizing above last year’s floor but has not re-established the momentum needed to revisit the #24 peak, suggesting incremental share capture rather than a breakout trajectory.

Notable Products
Berries N Cream Cereal Bar (100mg) posted the clearest surge in August 2026 with a +53.7% month-over-month lift to rank 4, while Fruity Krunch Cereal Bar (100mg) held rank 1 despite a -36.0% decline, signaling a reshuffle within the lineup. Cookies N Cream Cereal Bar (100mg) rose +36.0% to rank 2 and Cocoa Krunch Cereal Bar (100mg) climbed +44.1% to rank 3, whereas Cinnamon Krunch Cereal Bar (100mg) slid -42.0% at rank 6, indicating demand is rotating toward cream-forward variants over spiced profiles. Four of the top six are Cereal Bar SKUs, and with Cookies Krunch Cereal Treats (100mg) only up +3.9% at rank 5 against a $2,969 leader, the concentration in Cereal Bars suggests Muncheez Edibles (CO) is consolidating around dessert-style bar formats with a tilt toward berries and cream flavors.
Top Selling Cannabis Brands






Data for this report comes from real-time sales reporting by participating cannabis retailers via their point-of-sale systems, which are linked up with Headset’s business intelligence software. Headset’s data is very reliable, as it comes digitally direct from our partner retailers. However, the potential does exist for misreporting in the instance of duplicates, incorrectly classified products, inaccurate entry of products into point-of-sale systems, or even simple human error at the point of purchase. Thus, there is a slight margin of error to consider. Brands listed on this page are ranked in the top twenty within the market and product category by total retail sales volume.

