.svg)


Where to Buy
My Friend is stocked at 71 licensed dispensaries across Michigan, with the deepest coverage in New Buffalo, Detroit, Flint, White Pigeon, and Ann Arbor. Search by ZIP code or city below to find the closest one, or filter by product type if you are after a specific format.
Market Insights Snapshot
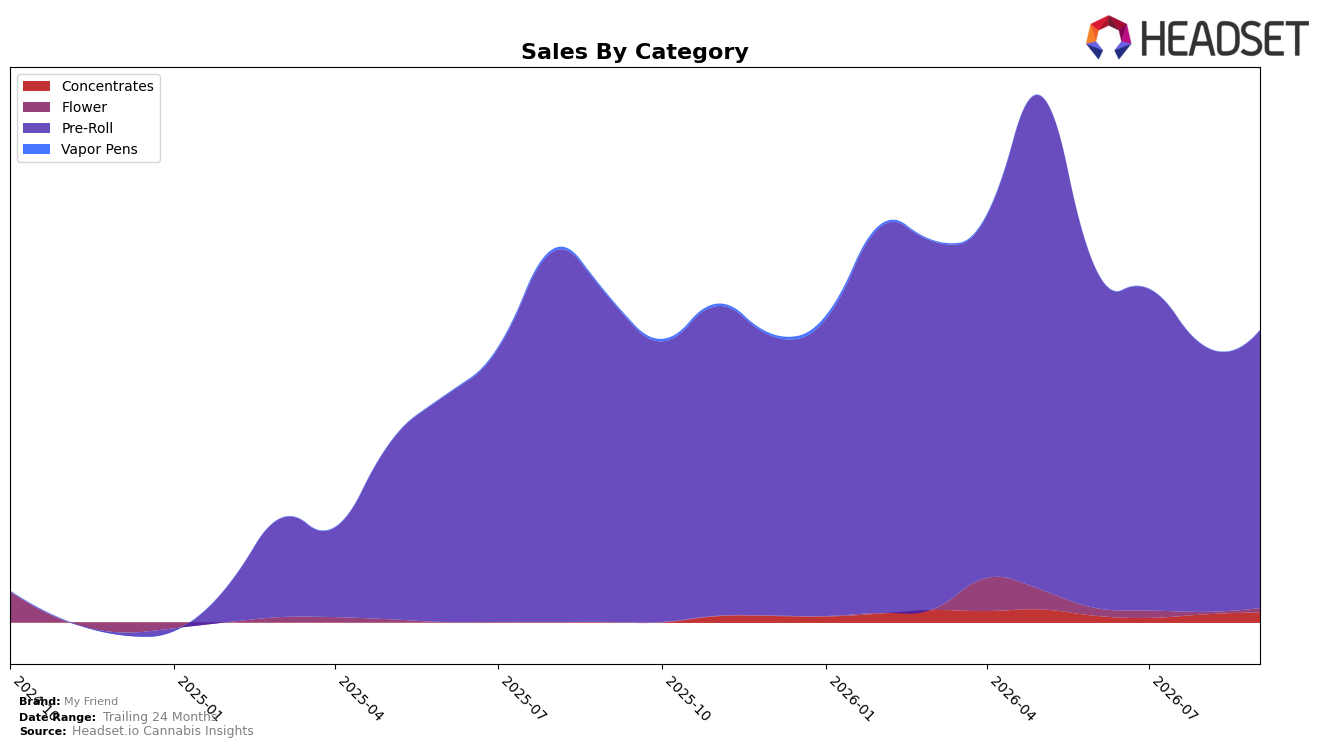
My Friend concentrated 95.22% of September 2026 sales in Pre-Roll, where category sales fell 14.57% year over year but rose 4.63% month over month, while Concentrates held 3.42% share with a 23.61% MoM increase and Flower reached 1.35% share on a 91.53% MoM surge. Despite a brand-level sales decline of 10.65% YoY and an 8.60% YoY rise in average price to $1.78, the aggregate MoM lift across non–Pre-Roll categories points to a portfolio that is starting to diversify from an extreme Pre-Roll dependency.
Holding rank 38 in Pre-Roll in Michigan while Pre-Roll comprises 95.22% of mix suggests constrained headroom in the core, and the 4.63% MoM uptick in that category contrasts with faster MoM gains of 23.61% in Concentrates and 91.53% in Flower. The pattern implies near-term positioning that trades a small Pre-Roll rebound for higher-growth adjacency bets, using modest share in Concentrates and Flower to counterbalance the 14.57% YoY Pre-Roll decline and mitigate risk tied to a single-category footprint.
Competitive Landscape
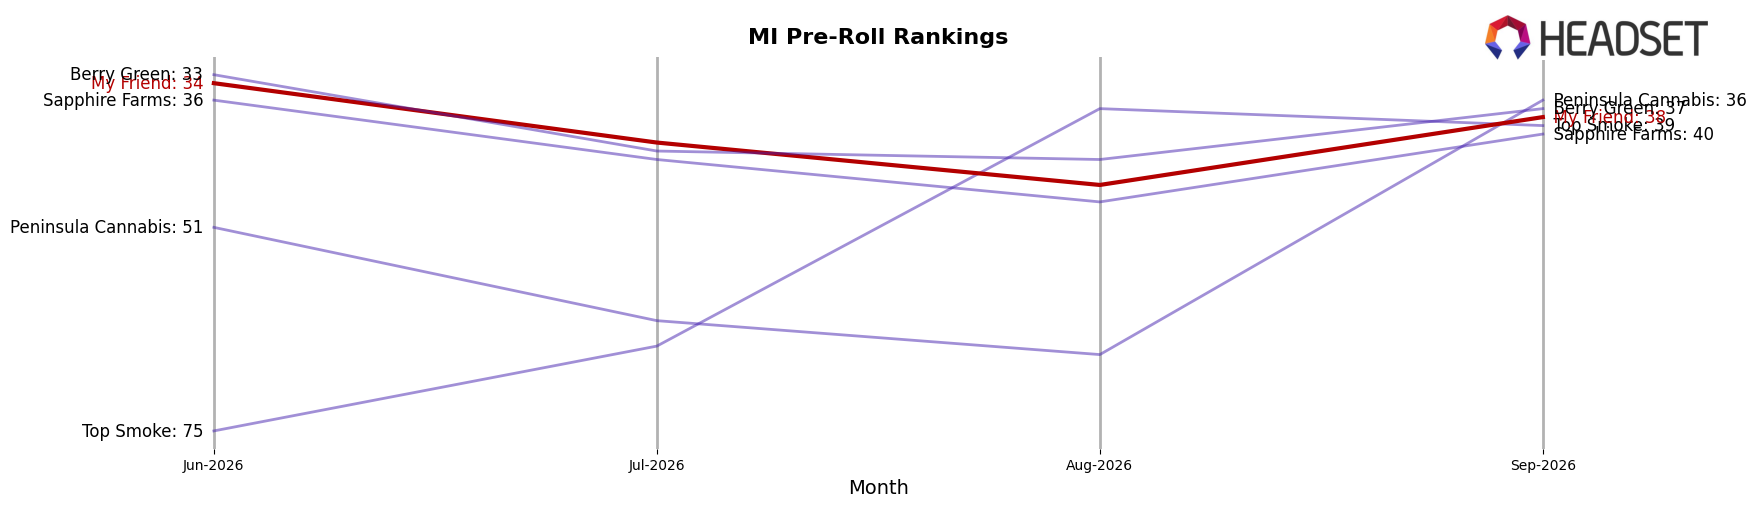
My Friend sits at rank #38 in Michigan Pre-Roll for September 2026, down 6 positions from rank #32 a year ago, and 4 positions below its June 2026 snapshot at #34; the brand’s peak at #22 in May 2026 contrasts with a 16-rank slide since that high-water mark, indicating fading placement momentum relative to both its own history and the leaderboard. Competitively, Jeeter held #1 year over year while growing sales by 149.9%, and Cali-Blaze stayed at #2 despite a 36.1% sales decline, implying that My Friend’s downward rank change outpaced even underperforming leaders; meanwhile, Dragonfly Cannabis maintained #3 with 8.4% growth as Mitten Extracts improved from #5 to #4, showing that mid-tier rivals advanced while My Friend slipped. The pattern implies a trajectory toward lower mid-pack relevance unless rank losses versus both stable leaders and climbing mid-tier brands are reversed.
Notable Products
Runtz Pre-Roll (1g) led September 2026 with a 108.8% month-over-month surge to rank 1, while Cap Jelly Pre-Roll (1g) fell 19.4% to rank 10. Grape Spritzer Pre-Roll (1g) advanced 62.7% alongside this shift, and Sherb Cream Pie Pre-Roll (1g) posted a 9.4% lift at rank 9. With all top-10 items in Pre-Roll and only one SKU declining double-digits, the mix indicates a push toward higher-velocity pre-rolls where momentum is consolidating in a few fast-moving flavors.
Top Selling Cannabis Brands






Data for this report comes from real-time sales reporting by participating cannabis retailers via their point-of-sale systems, which are linked up with Headset’s business intelligence software. Headset’s data is very reliable, as it comes digitally direct from our partner retailers. However, the potential does exist for misreporting in the instance of duplicates, incorrectly classified products, inaccurate entry of products into point-of-sale systems, or even simple human error at the point of purchase. Thus, there is a slight margin of error to consider. Brands listed on this page are ranked in the top twenty within the market and product category by total retail sales volume.

