.svg)
Aug-2026
Sales
Trend
6-Month
Product Count
SKUs
Avg Price
YoY Sales Change
YoY Price Change


Where to Buy
Nebula is stocked at 34 licensed dispensaries across Oklahoma, Minnesota, and 3 other states, 16 of them in Oklahoma, with the deepest coverage in Oklahoma City, Lawton, Broken Arrow, Cushing, and McLoud. Search by ZIP code or city below to find the closest one, or filter by product type if you are after a specific format.
Market Insights Snapshot
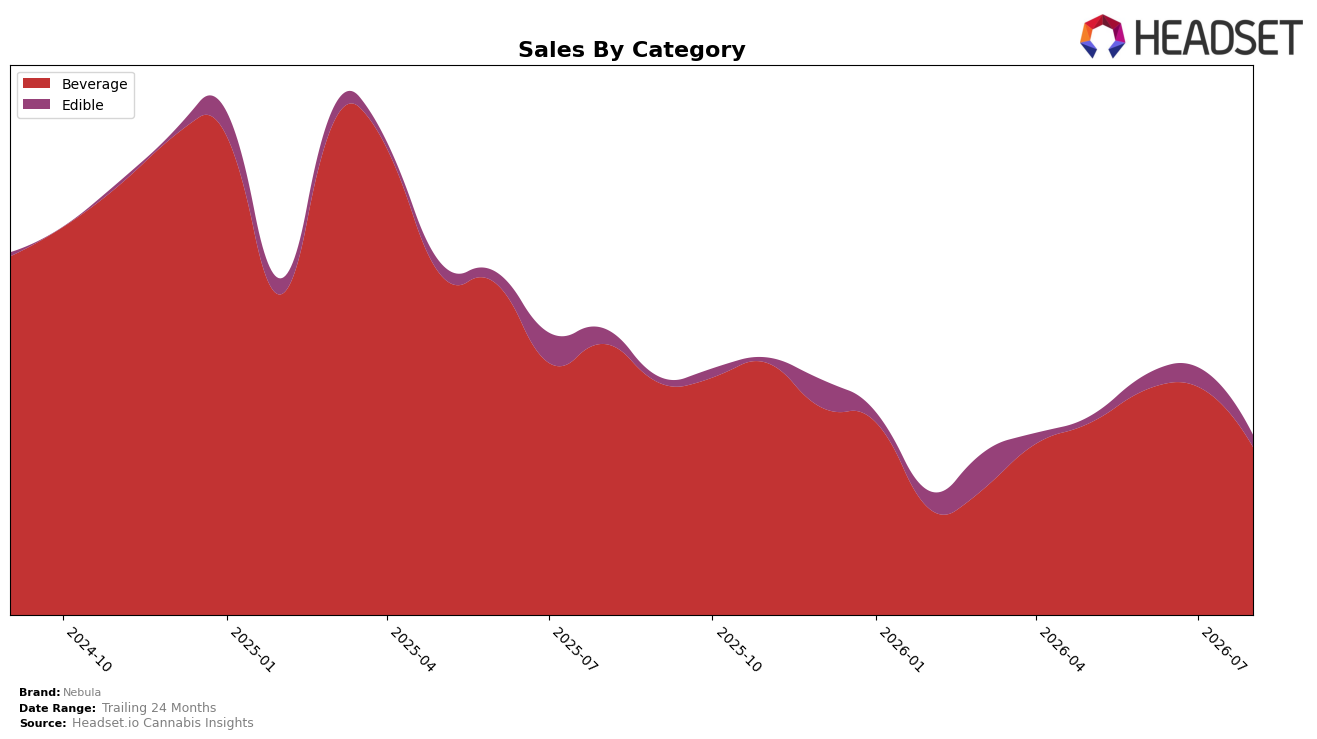
Nebula’s category mix in August 2026 skewed heavily to Beverage at 93.41% share with rank 7 in Beverage in Arizona, while Edible held 6.59% share; Beverage declined by 38.12% year over year and 26.49% month over month, and Edible fell 22.23% year over year and 38.24% month over month. With overall brand sales down 37.27% year over year and average price down 5.46%, the steeper month-over-month drop in Edible versus Beverage indicates the portfolio is consolidating around the Beverage core rather than diversifying, implying a tighter focus on a single-category identity despite broader 24-month contraction of 52.49%.
The mix shift implies Nebula is leaning into price-accessible Beverage positions (Beverage average price at $10.89 versus Edible at $40.26) while de-emphasizing higher-ticket Edible, as evidenced by Beverage’s 93.41% share and Edible’s 6.59% alongside rank 7 in Arizona Beverage. Because Beverage’s month-over-month decline of 26.49% is smaller than Edible’s 38.24% but its year-over-year drop of 38.12% is larger than Edible’s 22.23%, the near-term stability combined with longer-term erosion suggests Nebula’s positioning is anchored in Beverage frequency today but at risk of share loss over longer horizons unless mix breadth or pricing strategy evolves.
Competitive Landscape
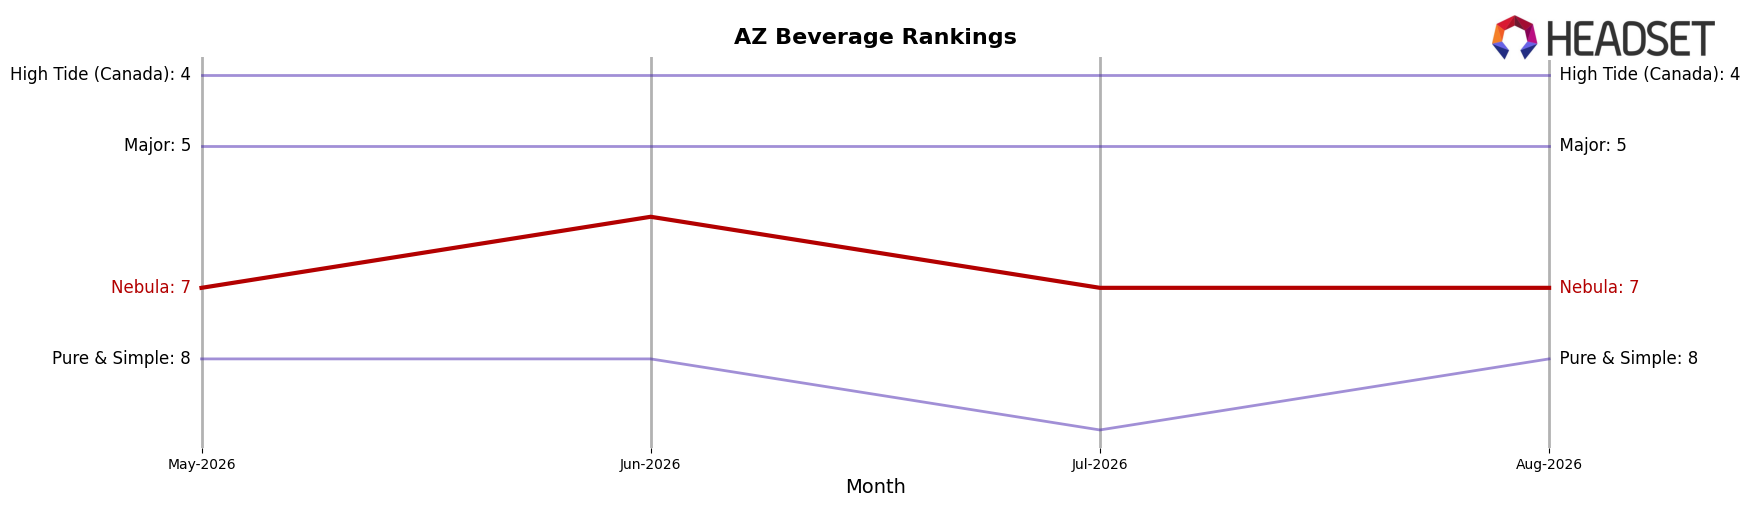
Nebula sits at #7 in AZ Beverage in August 2026, down 2 ranks year over year from #5, and flat versus the last three months at #7, signaling a stall since its peak at #3 in September 2024; meanwhile, Keef Cola held #1 with a 3.6% YoY sales lift while Nebula ceded two positions, and Uncle Arnie's advanced to #3 from #4 with 46.6% YoY sales growth as High Tide (Canada) slipped from #3 to #4 despite 16.7% YoY sales growth; the pattern implies Nebula’s rank trajectory is compressing toward the mid-pack, where maintaining #7 while rivals climb suggests share defense is now more urgent than recapture of its prior #3 peak.
Notable Products
Blue Razz Nectar Syrup (100mg) posted the steepest decline in August 2026 at -62.0% MoM while falling to rank 3, and Lemon Lime Syrup (100mg) dropped -48.4% MoM at rank 4, signaling a sharp pullback in core 100mg flavors. In contrast, Lemon Lime Nectar Syrup (100mg THC, 12oz, 355ml) rose +64.3% MoM into rank 8 and Tigerblood Nectar Syrup (1000mg) climbed +40.1% MoM at rank 7 with $4,210 in sales, while Vanilla Nectar Syrup (100mg) still held rank 1 despite a -18.1% MoM slide. Eight of the top ten are Beverage SKUs, concentrating demand in syrups even as Wild Strawberry Nectar Syrup (100mg) slipped -12.6% MoM at rank 2 and CBD/THC 1:1 Nectar - Pure Unflavored Syrup (100mg CBD, 100mg THC) fell -35.9% at rank 9. The pattern implies a migration from standard 100mg flavors toward differentiated formats and higher-potency or larger-pack syrups that can offset declines in legacy 100mg SKUs.
Top Selling Cannabis Brands






Data for this report comes from real-time sales reporting by participating cannabis retailers via their point-of-sale systems, which are linked up with Headset’s business intelligence software. Headset’s data is very reliable, as it comes digitally direct from our partner retailers. However, the potential does exist for misreporting in the instance of duplicates, incorrectly classified products, inaccurate entry of products into point-of-sale systems, or even simple human error at the point of purchase. Thus, there is a slight margin of error to consider. Brands listed on this page are ranked in the top twenty within the market and product category by total retail sales volume.

