.svg)

Sep-2026
Sales
Trend
6-Month
Product Count
SKUs
Avg Price
YoY Sales Change
YoY Price Change


Where to Buy
High Tide (Canada) is stocked at 194 licensed dispensaries across Arizona, Washington, and 5 other states, 52 of them in Arizona, with the deepest coverage in Tucson, Phoenix, Mesa, Tempe, and Flagstaff. Search by ZIP code or city below to find the closest one, or filter by product type if you are after a specific format.
Market Insights Snapshot
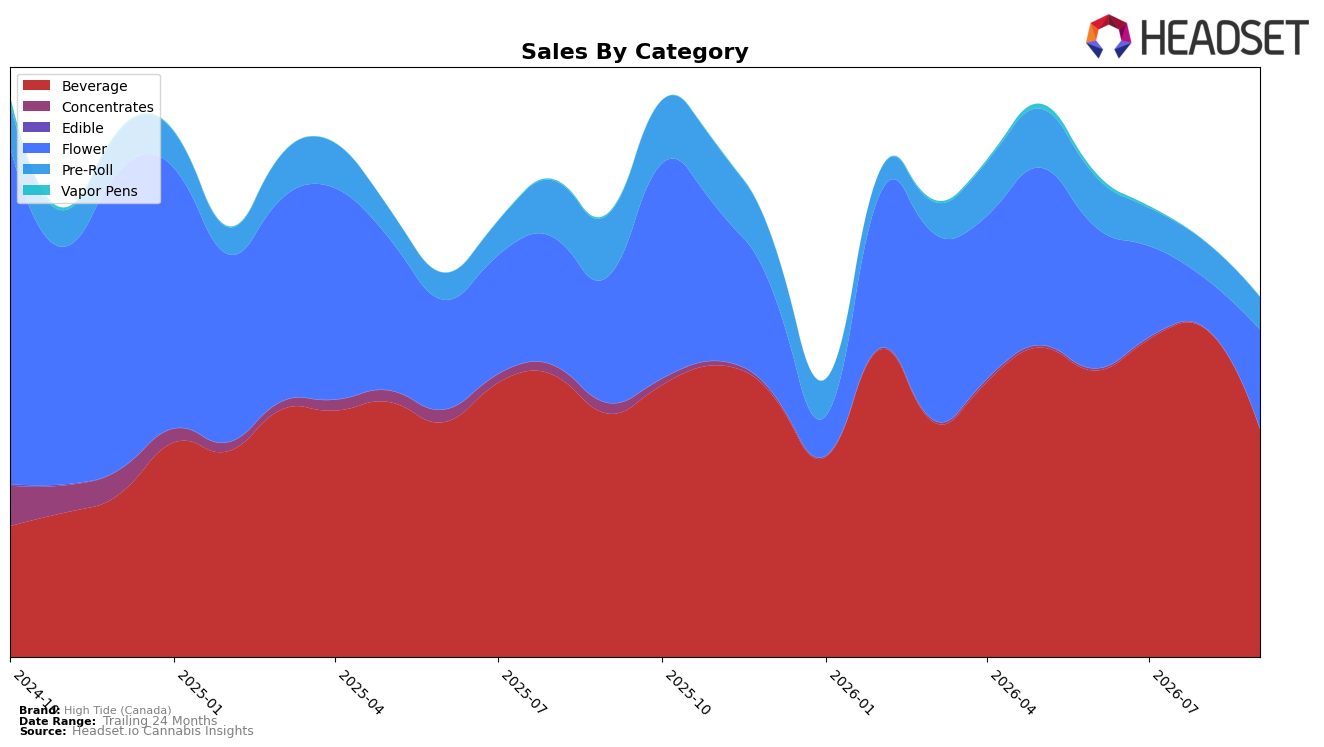
In September 2026, Beverage held 63.40% share with a month-over-month decline of 30.74% and a year-over-year decline of 6.48%, while Flower expanded to 27.55% share on a 101.85% month-over-month surge despite a 21.58% year-over-year drop. Pre-Roll contracted to 8.89% share with a 12.54% month-over-month decline and a 48.38% year-over-year decline, and Vapor Pens remained marginal at 0.17% share even as month-over-month units jumped 261.11% against a 44.95% year-over-year decline. The mix shift away from Beverage toward Flower, combined with brand-level sales down 18.89% year over year and an average price decrease of 12.82%, implies a pivot from value-oriented drinks toward replenishing higher-ticket inhalables to stabilize revenue per transaction.
With Beverage still the top category but down 30.74% month over month and Flower up 101.85% month over month, High Tide (Canada) appears to be rebalancing toward categories that can offset price compression, as the average price sits at $4.26 while Flower’s average price is $26.07. Holding rank 4 in Beverage in Arizona while Beverage share falls 63.40% to a more constrained role suggests maintaining a presence in value-led formats for traffic, but leaning into Flower to defend basket size, which positions the brand to trade customers across tiers rather than depending on a single category corridor.
Competitive Landscape
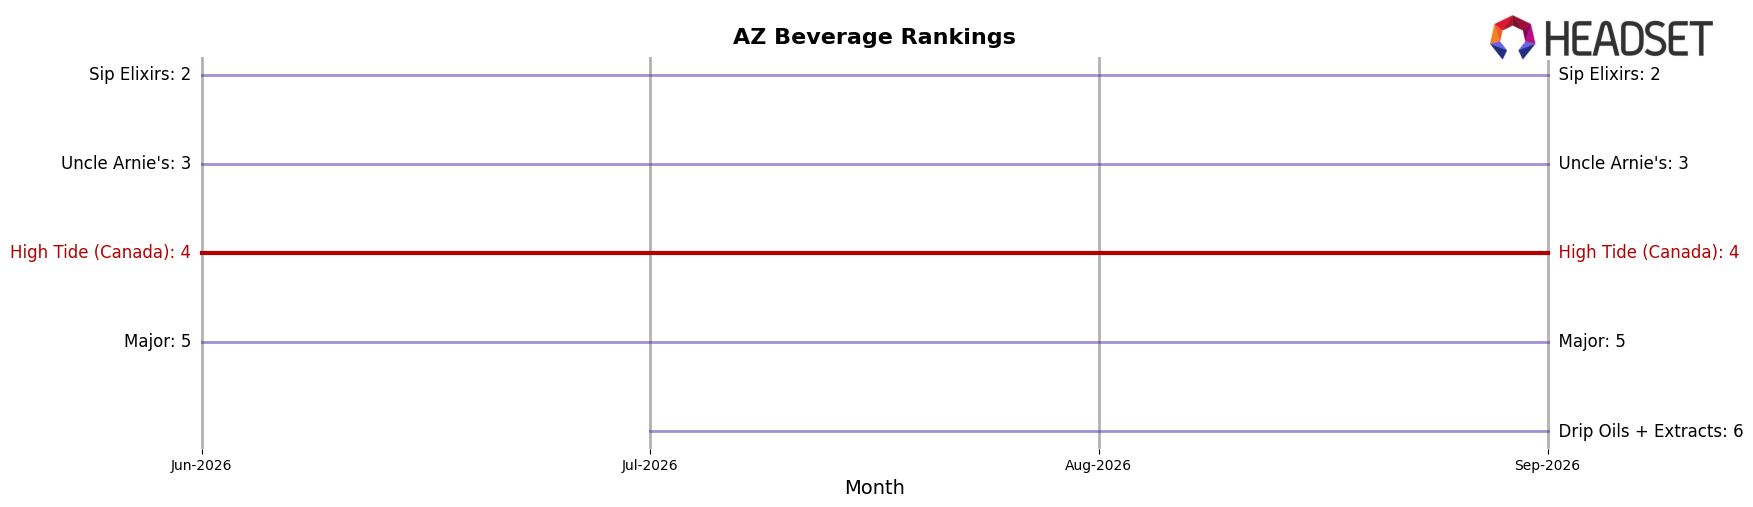
High Tide (Canada) sits at #4 in AZ Beverage in September 2026, down 1 rank from #3 year over year, and unchanged from #4 three months prior, while its peak of #3 in October 2025 marks a 1-position slide from its best. In contrast, Keef Cola held #1 year over year and remains #1 with sales up 4.38%, and Uncle Arnie's climbed from #4 to #3 with a 64.59% YoY sales gain, indicating upward pressure directly above High Tide (Canada). With Sip Elixirs steady at #2 despite a -1.23% YoY sales change and Major at #5, High Tide (Canada)’s flat three-month rank and year-over-year slippage of 1 position imply a stalled trajectory where modest competitor gains could displace it further unless rank momentum reverses.
Notable Products
Peach Mango Seltzer Beverage (10mg THC, 12oz) fell 51.1% month over month yet held rank 1, while Black Cherry Seltzer (10mg CBD, 10mg CBC, 10mg THC, 12oz, 355ml) slid 21.5% to rank 5, indicating volatility concentrated at the top of the lineup. In contrast, Prickly Pear Lime Seltzer (10mg CBD, 10mg CBC, 10mg THC, 12oz, 355ml) climbed 24.9% to rank 4 and the CBD/THC 1:1 Raspberry Lemon THC Seltzer (10mg CBD, 10mg THC, 12oz, 355ml) rose 12.4% at rank 2, and six of the top ten are Beverage SKUs, signaling category concentration despite mixed trajectories. Pre-Roll entrants appeared with Pink Runtz Pre-Roll 2-Pack (1g) at rank 8 and Unicorn Factory Pre-Roll (2g) at rank 9, while the 30mg seltzers split directionally with Raspberry Lemon down 13.9% at joint rank 7 and Peach Mango newly listed at joint rank 7, implying trial without consistent repeat yet. The mix points to High Tide (Canada) leaning into flavor-led beverages for scale while testing Pre-Rolls as a hedge against single-category risk.
Top Selling Cannabis Brands






Data for this report comes from real-time sales reporting by participating cannabis retailers via their point-of-sale systems, which are linked up with Headset’s business intelligence software. Headset’s data is very reliable, as it comes digitally direct from our partner retailers. However, the potential does exist for misreporting in the instance of duplicates, incorrectly classified products, inaccurate entry of products into point-of-sale systems, or even simple human error at the point of purchase. Thus, there is a slight margin of error to consider. Brands listed on this page are ranked in the top twenty within the market and product category by total retail sales volume.

