.svg)

Sep-2026
Sales
Trend
6-Month
Product Count
SKUs
Avg Price
YoY Sales Change
YoY Price Change


Market Insights Snapshot
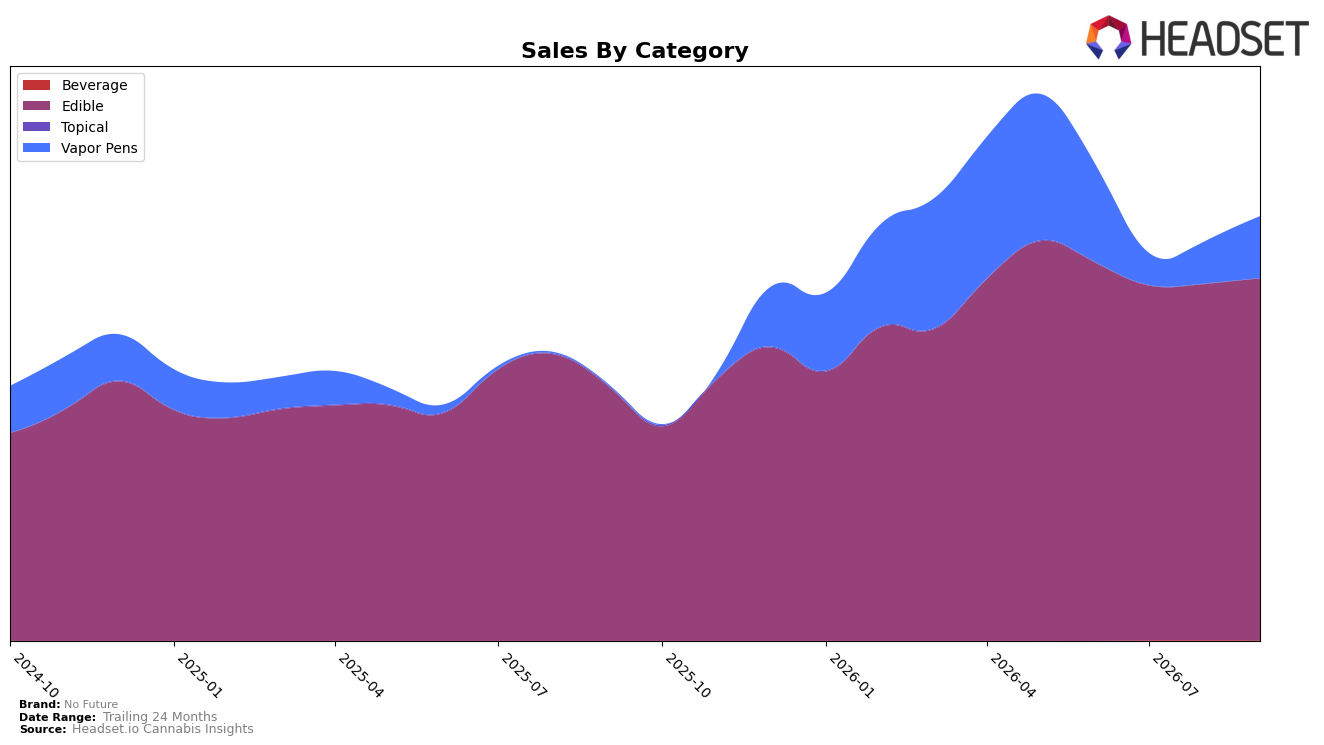
No Future concentrated 85.38% of September 2026 sales in Edible, where sales were up 42.29% year over year and 1.62% month over month, while Vapor Pens expanded to 14.52% share with a 7007.49% year-over-year jump and 46.82% month-over-month gain. Beverage contracted to 0.10% share with a -16.19% month-over-month move, and the brand held rank 3 in Edible in Alberta, indicating scale in the lead category even as mix diversification accelerates. The pattern implies a pivot from a single-category footprint toward a two-category stack led by Edible and fast-ramping Vapor Pens, with mix risk reduced despite Edible’s slower 1.62% month-over-month cadence versus Vapor Pens’ 46.82% surge.
The mix shift, paired with a 106.31% average price increase and 65.60% brand sales year-over-year growth in September 2026, implies demand tolerance for higher price points in Edible and a premiumized entry in Vapor Pens at a $26.02 average price versus $8.63 in Edible. With rank 3 in Edible in Alberta and Vapor Pens gaining 14.52% share, the brand’s positioning skews toward value-density: higher velocity at lower price in Edible complemented by higher ticket growth in Vapor Pens, suggesting margin headroom as mix tilts toward the faster-growing, higher-price segment while Beverage remains non-core at 0.10% share.
Competitive Landscape
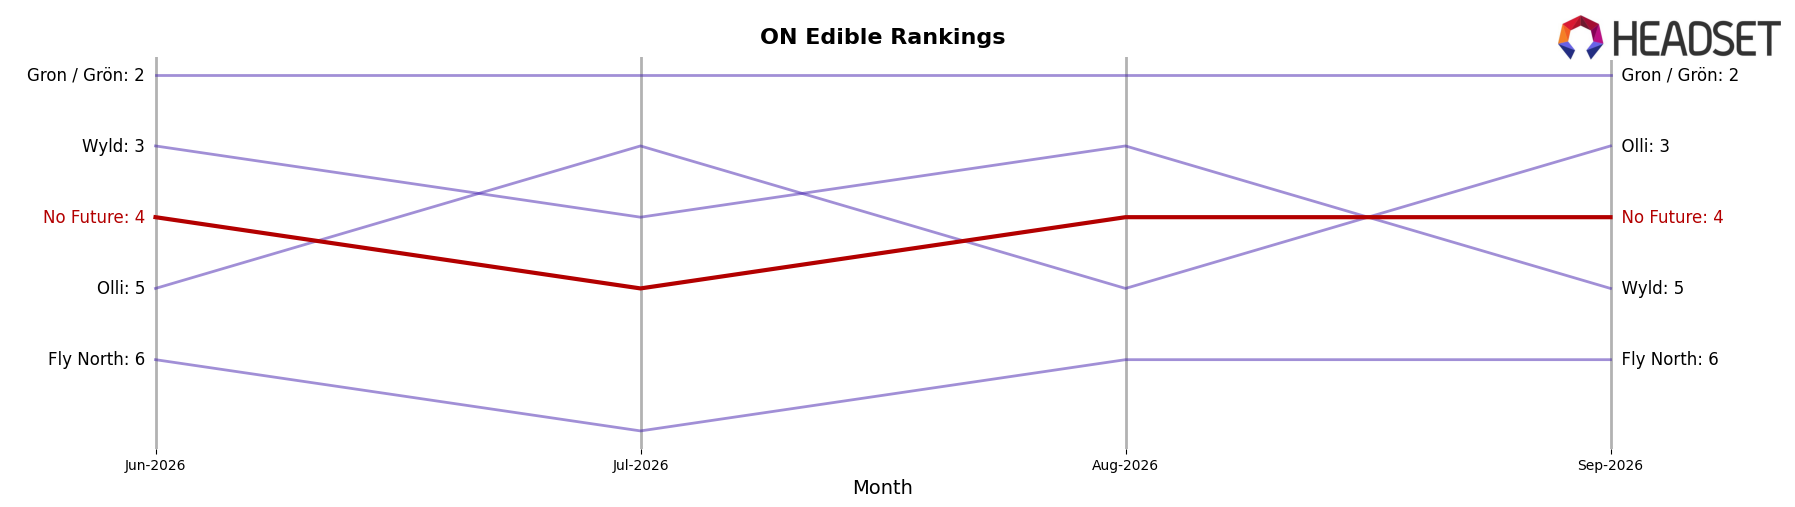
No Future sits at rank #4 in ON Edible in September 2026 after improving two positions from #6 year over year, and holding flat versus three months ago at #4, while reaching its peak rank of #4 in September 2026; meanwhile, Olli advanced from #5 to #3 year over year and Wyld slipped from #4 to #5, indicating that upward mobility around the #3–#5 corridor is active and susceptible to swaps driven by double-digit shifts like Olli’s 46.97% YoY sales growth and Wyld’s 17.81% YoY growth; at the top, Spinach held #1 year over year and Gron / Grön held #2 with single-digit YoY sales growth of 7.30% and 4.73% respectively, implying that No Future’s two-rank YoY climb to a new peak yet stall at #4 suggests a ceiling set by stable leaders and a need to displace the newly ascendant #3 to change trajectory.
Notable Products
10x The Madness Ratiod - CBD/CBG/THC 1:2:1 Tropic Boost Gummies 10-Pack (100mg CBD, 200mg CBG, 100mg THC) posted the steepest move in September 2026 with a -13.97% MoM drop to rank 7, while category leader The Blue One Sativa Bonbon Gummy (10mg) slipped -7.37% at rank 1. Ratioed - CBD/CBN/THC 2:1:1 Moon Berry Gummies 10-Pack (200mg CBD, 100mg CBN, 100mg THC) bucked the trend with +9.04% MoM at rank 2 as The Green One Indica Gummy (10mg) added +11.78% at rank 8. Nine of the top ten are Edible SKUs, and the concentration around mood-targeted formulations coincides with a mixed pattern of premiumized ratios gaining share while single-compound flagships soften.
Top Selling Cannabis Brands






Data for this report comes from real-time sales reporting by participating cannabis retailers via their point-of-sale systems, which are linked up with Headset’s business intelligence software. Headset’s data is very reliable, as it comes digitally direct from our partner retailers. However, the potential does exist for misreporting in the instance of duplicates, incorrectly classified products, inaccurate entry of products into point-of-sale systems, or even simple human error at the point of purchase. Thus, there is a slight margin of error to consider. Brands listed on this page are ranked in the top twenty within the market and product category by total retail sales volume.

