Jun-2026
Sales
Trend
6-Month
Product Count
SKUs
Avg Price
YoY Sales Change
YoY Price Change
Market Insights Snapshot
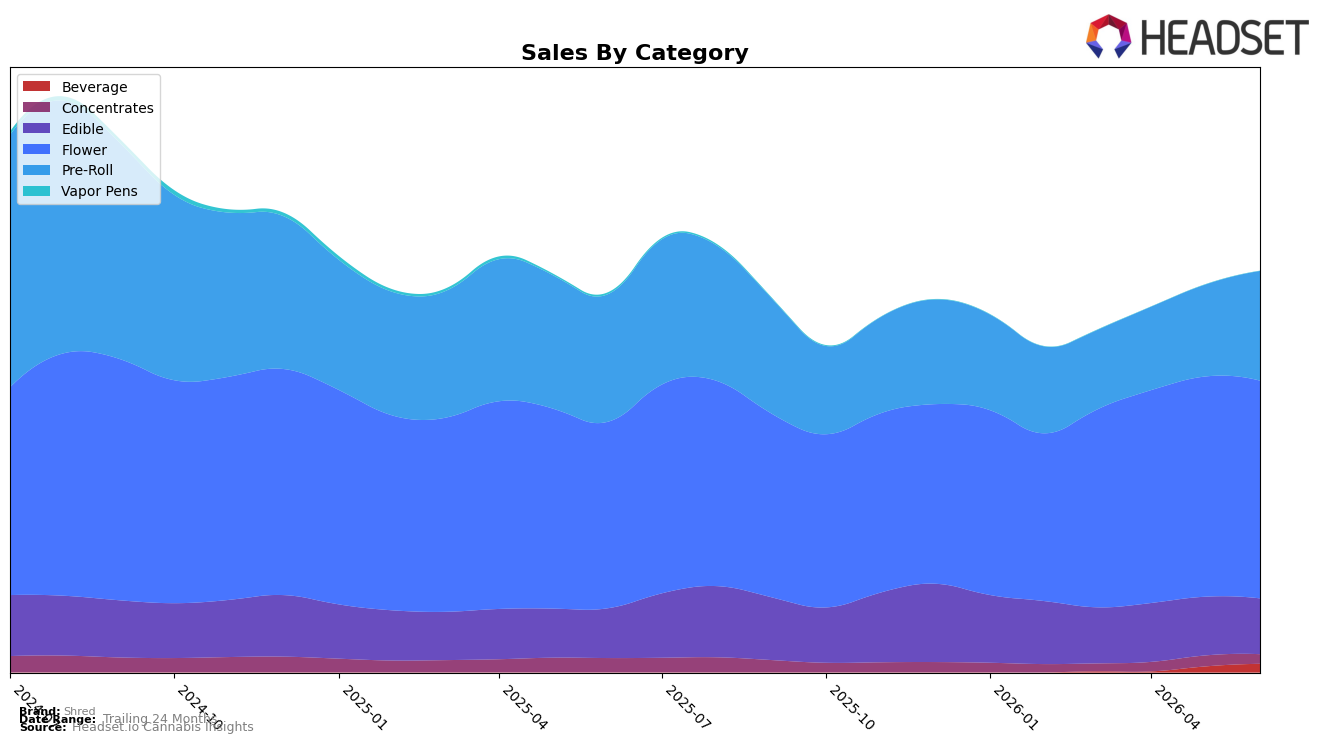
In June 2026, Shred’s mix concentrated in Flower at 54.31% share with year-over-year growth of 16.75% but a month-over-month dip of 1.10%, while Pre-Roll held 27.33% share with a 14.08% YoY decline alongside a 19.51% MoM rebound. Edible reached 13.87% share with 12.02% YoY growth but fell 5.05% MoM, and Concentrates shrank to 2.34% share with a 33.35% YoY drop and a 12.57% MoM decline; Beverage remained small at 2.14% share yet surged 45.19% MoM, and Vapor Pens collapsed to 0.02% share with a 96.38% YoY decline and a 53.55% MoM drop. The pattern implies a pivot back toward inhalable core strength anchored by Flower and a tactical MoM push in Pre-Roll, while low-base Beverage experimentation offsets attrition in Concentrates and Vapor Pens, supporting overall brand sales up 5.67% YoY despite a 22.45% YoY rise in average price.
With a rank of 2 in Flower in Ontario and Flower delivering 54.31% of mix alongside 16.75% YoY growth, Shred’s positioning leans on scale leadership where it holds relative pricing power, even as category average price sits at $33.38 versus the brand’s overall $20.15. The 19.51% MoM lift in Pre-Roll against a 14.08% YoY decline indicates targeted promo or assortment resets aimed at share defense, while the 45.19% MoM Beverage spike and 5.05% MoM Edible pullback suggest trial cycling rather than durable portfolio expansion. The implication is a defend-and-trade-up stance: protect rank in Flower to anchor visibility and margin, use episodic Pre-Roll volume to stabilize monthly share, and limit exposure to structurally declining niches where Vapor Pens fell 96.38% YoY and Concentrates dropped 33.35% YoY.
Competitive Landscape
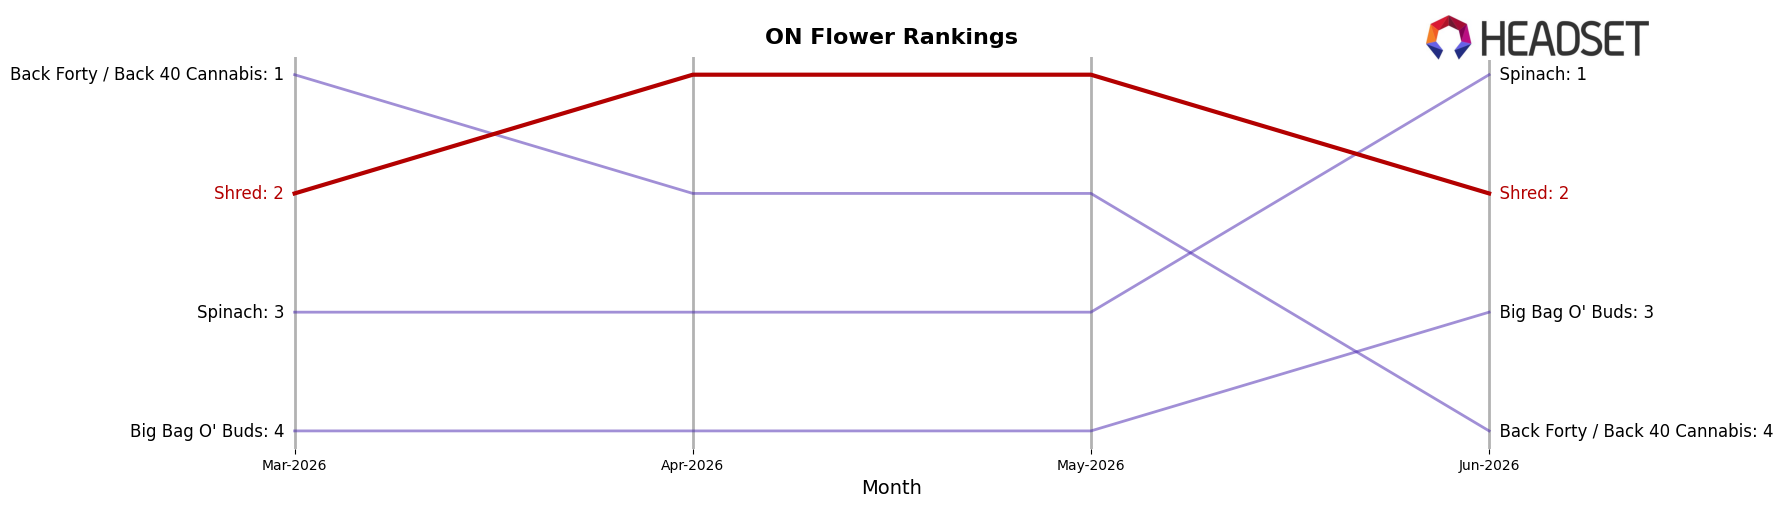
Shred is currently ranked #2 in ON Flower, unchanged from #2 year over year, while its peak at #1 in May 2026 contrasts with a steady #2 position across the last three months; in parallel, Spinach climbed from #4 to #1 with a 38.3% YoY sales increase, and Back Forty / Back 40 Cannabis slipped from #1 to #4 with an 11.3% YoY decline, indicating competitive pressure both above and below Shred’s slot. With Big Bag O' Buds holding at #3 year over year and The Original Fraser Valley Weed Co. rising from #8 to #5 on 26.5% YoY growth, the stability at #2 alongside a one-month peak implies Shred’s trajectory is plateauing without share capture from the category leader.
Notable Products
Shred'em Pop! - Crazy Cream Soda Gummies 4-Pack (10mg) posted the headline move in June 2026 with a 20.0% month-over-month gain into rank 3, while OG Rootbeer Milled (7g) slid 7.2% month over month to rank 6, indicating shifting velocity from milled flower toward confections. Shred'ems - CBD/THC 4:1 Wild Berry Blaze Gummy 4-Pack (40mg CBD, 10mg THC) held rank 1 with a 2.7% lift as Gnarberry (7g) climbed 5.8% at rank 2, and with three Edible SKUs in the top seven the mix skews toward gummies even as two Flower SKUs remain in the top four. Tropic Thunder (7g) added 4.8% at rank 4 while Shred'ems - CBD/THC 2:1 Sour Blue Razzberry Gummies 4-Pack (20mg CBD,10mg THC) grew 5.9% at rank 5, and the Blue Razzberry Shotz beverage sits at rank 10 with $44,704, reinforcing that ancillary formats are secondary to gummies. The pattern implies Shred is consolidating around flavor-led gummies for volume growth while core 7g flower sustains scale but cedes marginal momentum.
Top Selling Cannabis Brands
Data for this report comes from real-time sales reporting by participating cannabis retailers via their point-of-sale systems, which are linked up with Headset’s business intelligence software. Headset’s data is very reliable, as it comes digitally direct from our partner retailers. However, the potential does exist for misreporting in the instance of duplicates, incorrectly classified products, inaccurate entry of products into point-of-sale systems, or even simple human error at the point of purchase. Thus, there is a slight margin of error to consider. Brands listed on this page are ranked in the top twenty within the market and product category by total retail sales volume.

