.svg)


Where to Buy
Nom Nom Edible Co is stocked at 179 licensed dispensaries across Michigan and New York, 163 of them in Michigan, with the deepest coverage in Detroit, New Buffalo, Lansing, Flint, and Monroe. Search by ZIP code or city below to find the closest one, or filter by product type if you are after a specific format.
Market Insights Snapshot
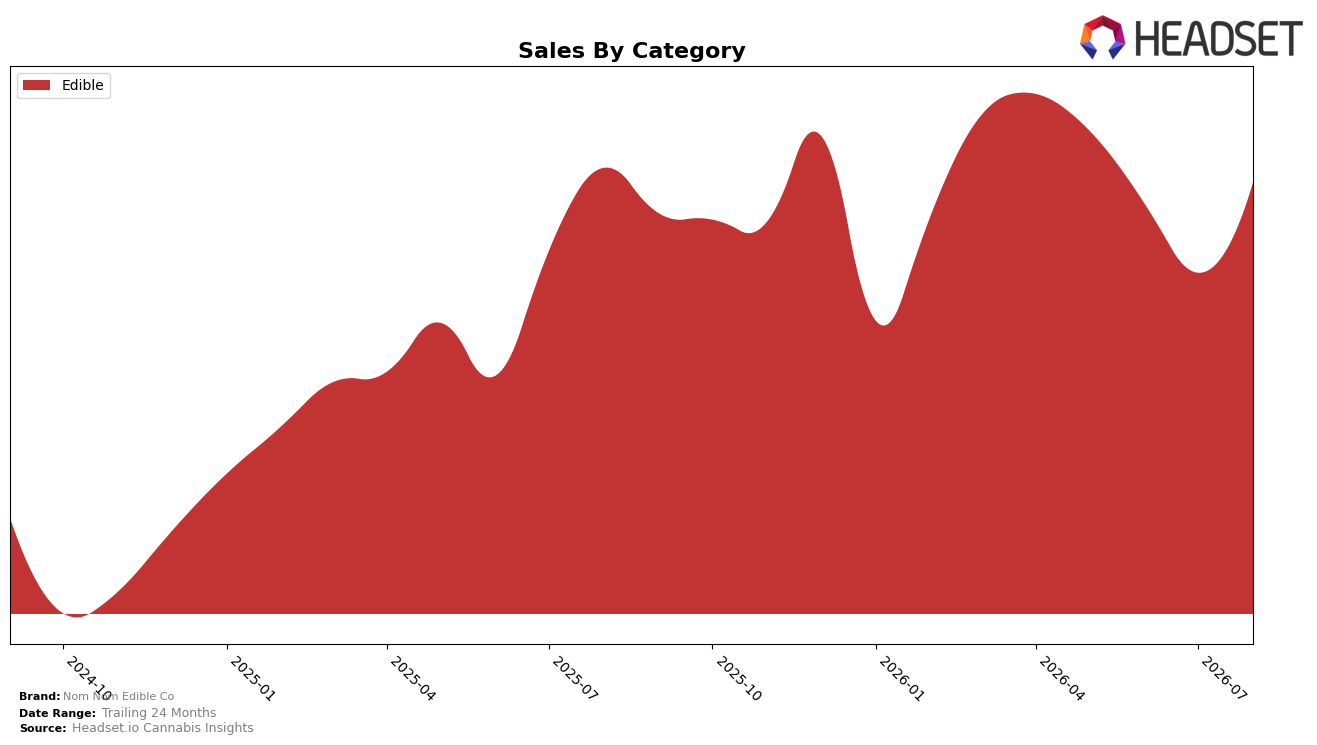
Nom Nom Edible Co concentrated 100.0% of August 2026 sales in Edible, with category sales up 19.55% month over month and down 2.53% year over year, while the brand’s average price rose 15.08% versus August 2025. Within Michigan Edible, the brand sat at rank 29 and expanded MoM faster than the category share moved (19.55% MoM vs. 0.00% mix shift), implying the growth came from velocity and pricing, not portfolio breadth.
The single-category focus, a 15.08% YoY price increase, and a 2.53% YoY sales dip point to elasticity pressure offset by August 2026 MoM velocity gains of 19.55%, indicating recent promotional or distribution lift without diversification hedge. Holding rank 29 in Michigan while posting a 205.80% 24‑month sales increase suggests the positioning is mid-pack on scale but levered to price-led revenue, implying sustained share requires either further velocity at current price points or targeted pack-size architecture to moderate elasticity.
Competitive Landscape
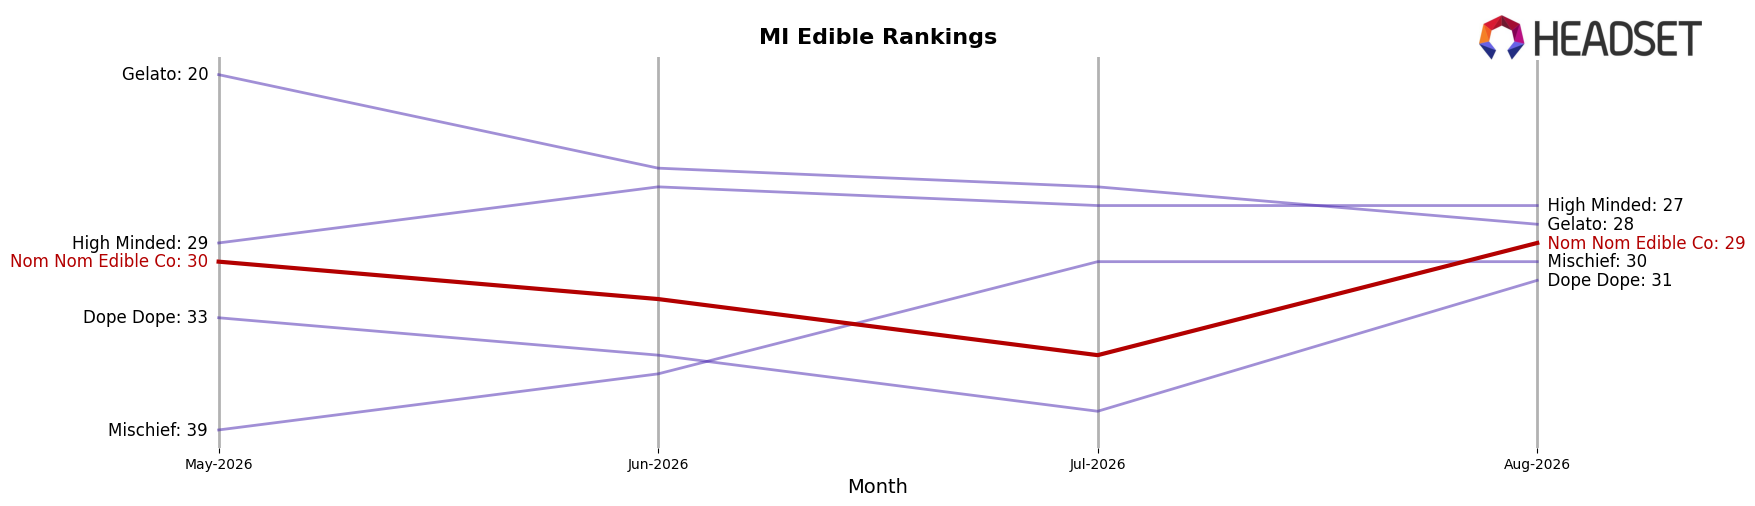
Nom Nom Edible Co sits at rank #29 in MI Edible for August 2026, down 1 position from #28 year over year and up 1 spot from #30 in May 2026, indicating a narrow band of movement against a market where Wyld held #1 while posting a -22.8% YoY sales change and Camino climbed from #4 to #3 with +22.1% YoY growth; relative to February 2026, when Nom Nom Edible Co peaked at #26, the current -3 rank drift and the competitor Play Cannabis rising from #11 to #5 signal that Nom Nom Edible Co is being outpaced by upward movers despite some stability, implying a flat-to-slightly-declining trajectory that risks ceding share unless rank momentum improves.
Notable Products
Mucho Mango Live Resin Gummies 10-Pack (200mg) posted the steepest decline in August 2026 at -29.96% MoM and slid to rank 9, while THC/CBN 4:1 Black & Blue Sleep Gummies 10-Pack (200mg THC, 50mg CBN) jumped 44.27% MoM into rank 8. Johnny Apple Gummies 10-Pack (200mg) rose 22.27% MoM to hold rank 1 and Blue Dream Live Resin Gummies 10-Pack (200mg) advanced 18.92% MoM at rank 2, whereas Pineapple Punch Live Resin Gummies 10-Pack (200mg) fell -6.71% MoM at rank 5. Eight of the top ten are Live Resin Gummies, pointing to concentration in a single edible format even as one sleep-focused SKU with minor cannabinoids expands share, implying a shift toward function-led differentiation within a stable gummy core.
Top Selling Cannabis Brands






Data for this report comes from real-time sales reporting by participating cannabis retailers via their point-of-sale systems, which are linked up with Headset’s business intelligence software. Headset’s data is very reliable, as it comes digitally direct from our partner retailers. However, the potential does exist for misreporting in the instance of duplicates, incorrectly classified products, inaccurate entry of products into point-of-sale systems, or even simple human error at the point of purchase. Thus, there is a slight margin of error to consider. Brands listed on this page are ranked in the top twenty within the market and product category by total retail sales volume.

