.svg)

Sep-2026
Sales
Trend
6-Month
Product Count
SKUs
Avg Price
YoY Sales Change
YoY Price Change


Where to Buy
MKX Oil Company is stocked at 482 licensed dispensaries across Michigan, New Jersey, and 2 other states, 458 of them in Michigan, with the deepest coverage in Detroit, New Buffalo, Grand Rapids, Monroe, and Flint. Search by ZIP code or city below to find the closest one, or filter by product type if you are after a specific format.
Market Insights Snapshot
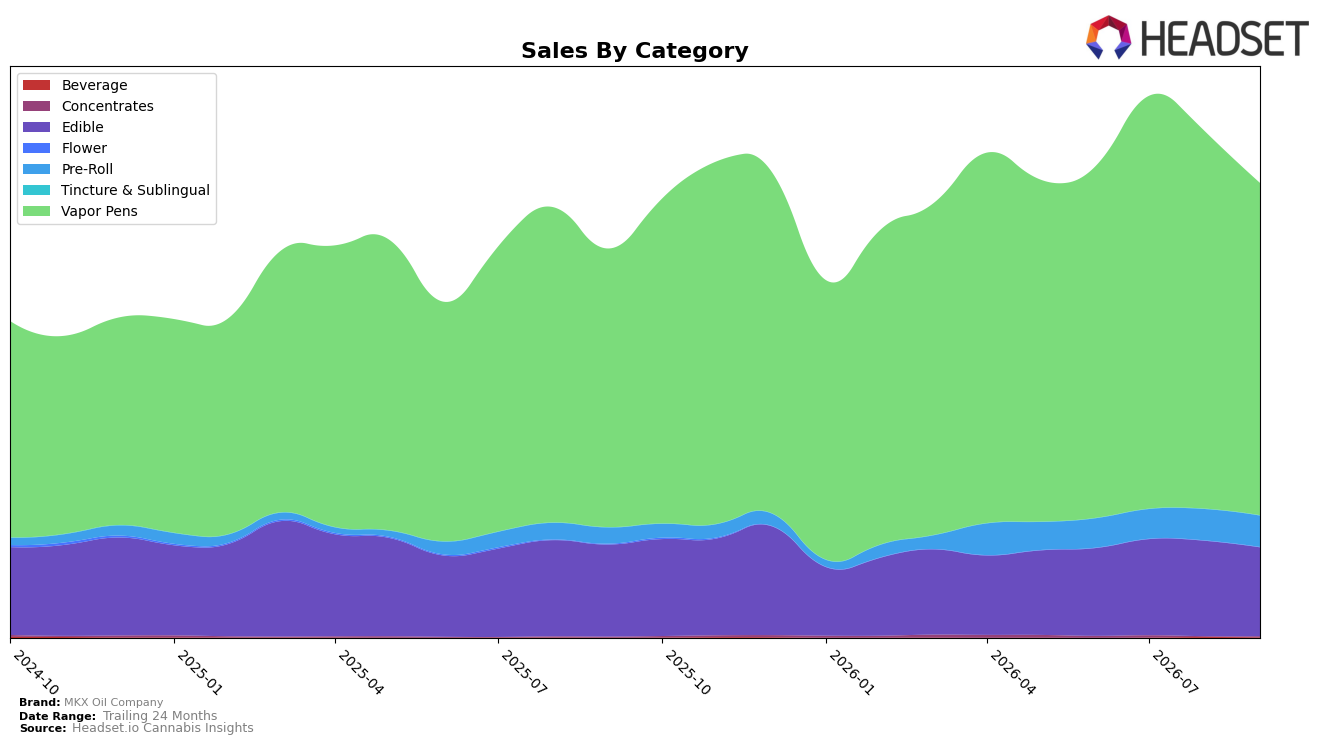
MKX Oil Company entered September 2026 with Vapor Pens at 73.34% share, up 19.30% year over year but down 12.02% month over month, while Edible held 19.55% share with a 3.52% YoY decline and a 6.91% MoM pullback. Pre-Roll expanded to 6.83% share on 96.45% YoY growth and a flat 0.05% MoM change, and niche formats moved unevenly as Concentrates rose 24.36% YoY and 71.81% MoM to 0.19% share while Beverage surged 132.98% YoY but slid 45.52% MoM to 0.10% share. With average price up 11.73% YoY to $9.06 and brand sales up 16.95% YoY, the pattern implies MKX Oil Company is leaning on a high-velocity Vapor Pens core while reallocating attention toward higher-growth edges like Pre-Roll, accepting MoM volatility to protect category breadth.
That mix shift positions MKX Oil Company to defend leadership in Vapor Pens, where it holds rank 1 in Michigan, even as MoM softness of 12.02% suggests near-term saturation risk and price elasticity after an 11.73% YoY price lift. The 96.45% YoY gain in Pre-Roll against a 0.05% MoM plateau indicates emerging traction that can hedge Vapor Pens cyclicality, while the 45.52% MoM contraction in Beverage versus 132.98% YoY growth flags an experimental tail best treated as opportunistic rather than foundational. Net, with total sales up 16.95% YoY and a 40.42% 24‑month rise, the implication is a core-dominant portfolio that can sustain share by converting Pre-Roll momentum into a secondary pillar while managing Edible’s 3.52% YoY drag and concentrating promotional weight where rank leadership can be defended.
Competitive Landscape
MKX Oil Company sits at rank #1 in MI Vapor Pens in September 2026 after climbing 2 positions year over year from #3, while holding #1 across the last three months and peaking at #1 in September 2026, signaling a consolidation at the top. In contrast, Mitten Extracts is at #2 after slipping from #1 year over year with a -12.9% sales change, and Muha Meds sits at #3 after falling from #2 with a -27.7% decline, whereas Society C surged from #12 to #4 with +276.2% sales growth, indicating pressure from below even as Platinum Vape eased from #4 to #5 with a -1.4% shift. The pattern implies MKX Oil Company’s ascent and three-month hold at #1 are driven more by competitor contraction at the top than by a broad market lift, so sustaining #1 will likely depend on defending against fast-rising mid-pack movers like Society C while capitalizing on share ceded by Mitten Extracts and Muha Meds.

Notable Products
Chronic Cherry Xxtra Strength Gummies 10-Pack (200mg) posted the steepest decline in September 2026 at -12.35% while dropping behind Strawberry Kush Gummies 10-Pack (200mg), which rose 9.01% to rank 1 from a lower prior position. Ganja Grape Gummies 10-Pack (200mg) eased -5.15% at rank 2, and Tangerine Dream Xxtra Strength Gummies 10-Pack (200mg) fell -15.75% at rank 6, signaling concentrated pressure in mid-table positions. With eight of the top ten coming from the Edible category and only two Vapor Pens entries at ranks 7 and 10, the mix implies MKX Oil Company is leaning into breadth within Edibles even as volatility within that family requires sharper flavor-level portfolio pruning.
Top Selling Cannabis Brands






Data for this report comes from real-time sales reporting by participating cannabis retailers via their point-of-sale systems, which are linked up with Headset’s business intelligence software. Headset’s data is very reliable, as it comes digitally direct from our partner retailers. However, the potential does exist for misreporting in the instance of duplicates, incorrectly classified products, inaccurate entry of products into point-of-sale systems, or even simple human error at the point of purchase. Thus, there is a slight margin of error to consider. Brands listed on this page are ranked in the top twenty within the market and product category by total retail sales volume.

