.svg)

Sep-2026
Sales
Trend
6-Month
Product Count
SKUs
Avg Price
YoY Sales Change
YoY Price Change


Market Insights Snapshot
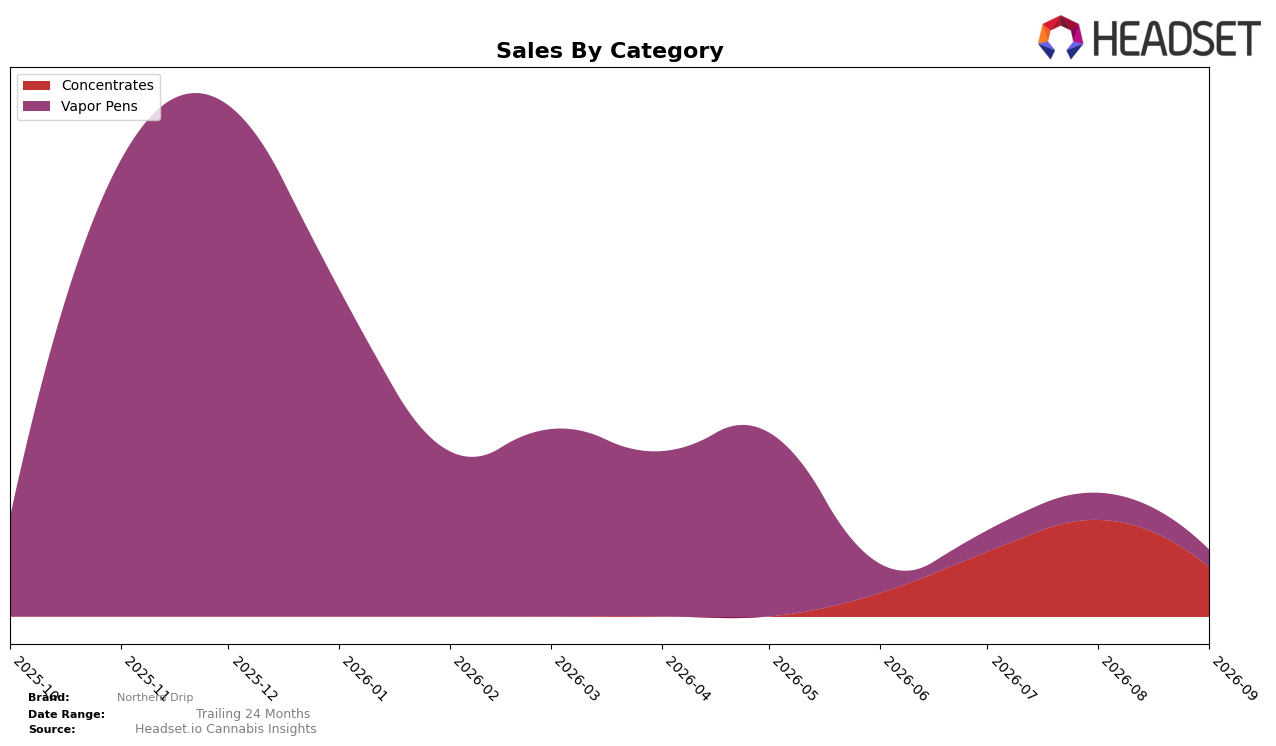
Northern Drip concentrated its September 2026 mix in Concentrates at 74.07% share while Vapor Pens held 25.93%, and both categories contracted month over month with Concentrates down 49.18% and Vapor Pens down 35.53%. The average price gap between Concentrates at $31.09 and Vapor Pens at $27.88 sits alongside an overall brand average price of $30.19, indicating a mix-weighted premium even as volume likely softened; with no year-over-year percentages in the feed, the immediate pattern is a sharp MoM retrenchment concentrated in the larger category. The state context centers on British Columbia, where the rank in Concentrates is unspecified, implying that September 2026 performance pressure is mix-driven rather than rank-led and that exposure to Concentrates magnified the month’s downturn.
The 48-point gap between category shares (74.07% vs. 25.93%) combined with a 13.65 percentage-point steeper MoM decline in Concentrates (-49.18% vs. -35.53%) implies concentration risk: the category that defines the brand’s identity is also the one dragging overall momentum. With the higher-priced Concentrates anchoring both price perception and volume, a sustained -49.18% MoM shock can compress visibility in British Columbia if not counterbalanced by Vapor Pens, whose smaller 25.93% base limits offset capacity; the positioning takeaway is that Northern Drip’s current mix over-indexes to volatility, and rebalancing even 5–10 percentage points toward Vapor Pens would reduce sensitivity to single-category swings while preserving the brand’s price corridor.
Competitive Landscape
Northern Drip sits at rank #48 in BC Concentrates in September 2026, a 14-place climb from #62 in June 2026, while still trailing its peak position of #39 reached in August 2026; by contrast, Endgame holds #1 despite a -13.2% year-over-year sales decline and Dabble Extracts advanced to #3 alongside a 242.3% year-over-year sales increase. The 9-rank pullback from #39 in August 2026 to #48 in September 2026, coupled with a 14-rank improvement versus three months prior, points to momentum that is present but volatile relative to faster-rising leaders, implying Northern Drip’s trajectory is upward but requires stabilization to convert short-term gains into durable rank.

Notable Products
White Widow Shatter (1g) led the movement in September 2026 with a -64.9% month-over-month decline while holding rank 3, outpacing the -42.5% drop of Fruit Jack Distillate Cartridge (1g) at rank 2. Pink Kush Shatter (1g) fell -35.0% yet stayed at rank 1, and two of the top three SKUs are Concentrates, indicating category reliance despite contraction. This pattern implies Northern Drip is concentrated in shatter formats that are shedding velocity faster than Vapor Pens, suggesting a near-term rebalancing toward cartridges to stabilize rank and mix.
Top Selling Cannabis Brands






Data for this report comes from real-time sales reporting by participating cannabis retailers via their point-of-sale systems, which are linked up with Headset’s business intelligence software. Headset’s data is very reliable, as it comes digitally direct from our partner retailers. However, the potential does exist for misreporting in the instance of duplicates, incorrectly classified products, inaccurate entry of products into point-of-sale systems, or even simple human error at the point of purchase. Thus, there is a slight margin of error to consider. Brands listed on this page are ranked in the top twenty within the market and product category by total retail sales volume.

