Market Insights Snapshot
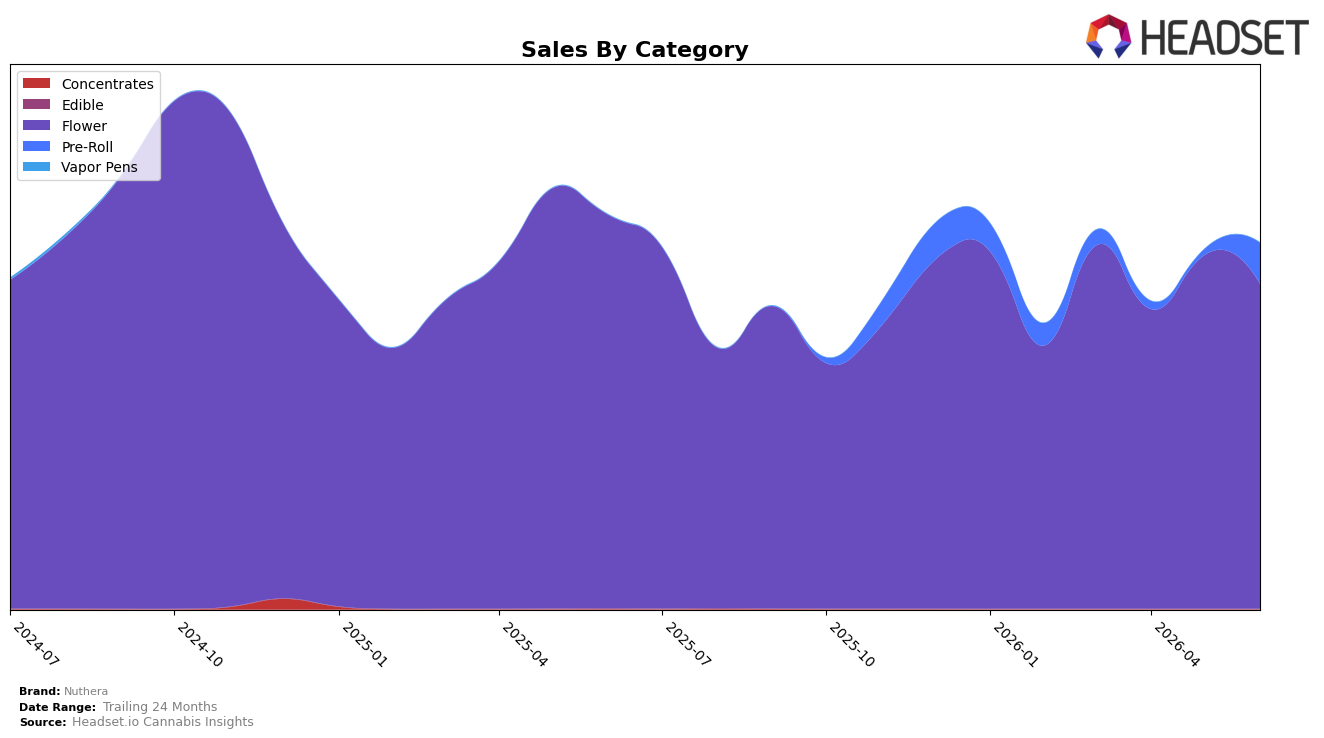
In June 2026, Nuthera concentrated 88.85% of sales in Flower while Pre-Roll carried 11.15% of mix, with Flower down 17.44% year over year and 8.15% month over month, versus Pre-Roll spiking 612.37% month over month from a near-zero base and lacking a year-over-year comp. Despite a 37.49% year-over-year drop in average price to $22.99, overall brand sales declined 7.17% year over year as Flower’s contraction outweighed Pre-Roll’s surge. The brand sat at rank 20 in Flower in Missouri, indicating mid-pack velocity while the category mix shifts toward lower-ticket units; the pattern implies Nuthera is trading down on price to stabilize volume but remains dependent on a single category where it holds only the 20th position.
The 612.37% month-over-month lift in Pre-Roll alongside an 8.15% month-over-month decline in Flower implies a tactical pivot toward trial-sized, lower-priced formats to counteract Flower volatility, yet the 88.85% share concentration suggests exposure persists if Flower softness continues. With brand sales down 7.17% year over year but up 6.85% over 24 months, and the average price falling 37.49% year over year while the Flower category rank sits at 20 in Missouri, the mix indicates a value-led positioning that can pull in incremental units short term but risks eroding premium perception and margin if Flower keeps shrinking and Pre-Roll does not scale beyond 11.15% share.
Competitive Landscape
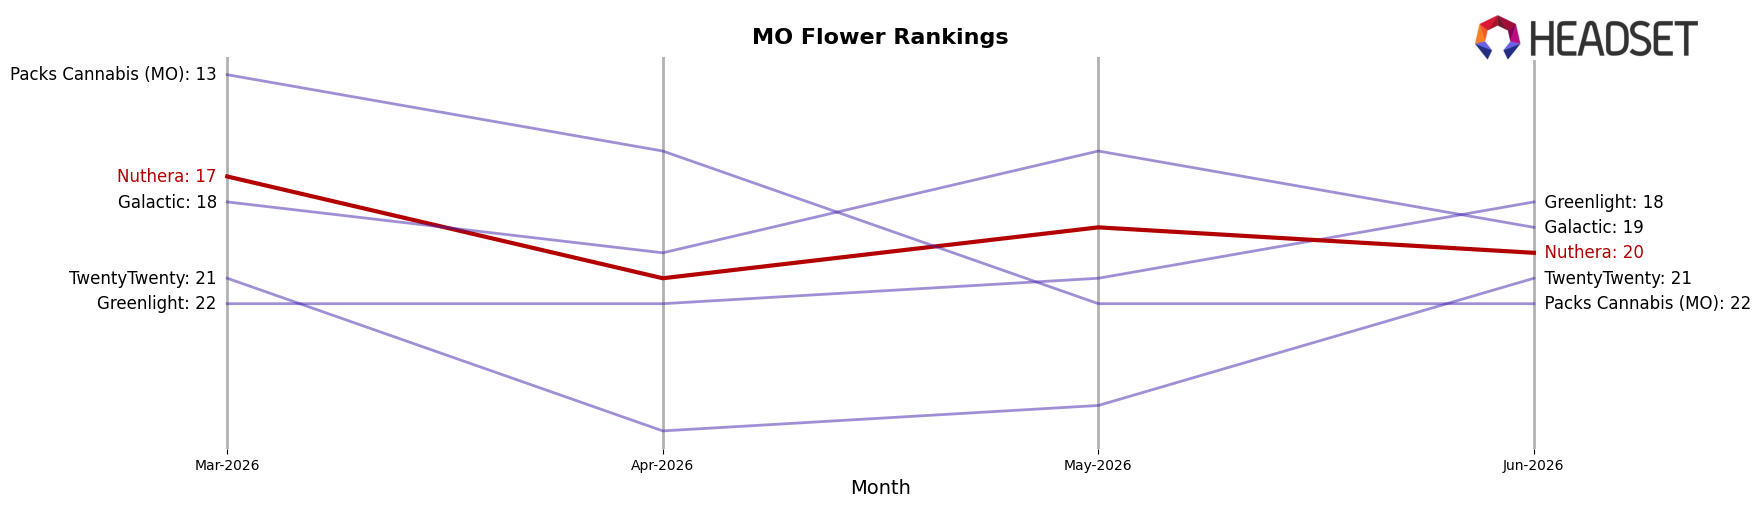
Nuthera sits at rank #20 in MO Flower in June 2026, down 4 positions year over year from #16, and off 3 spots from March 2026’s #17, while still trailing its peak of #15 from May 2025; in contrast, Flora Farms held at #1 year over year despite a 5.1% sales decline and Sinse Cannabis advanced from #5 to #2 with a 33.2% sales increase, indicating leaders are consolidating rank even as some face negative growth. With Amaze Cannabis climbing from #6 to #4 on 43.8% sales growth and Local Cannabis Co. moving from #10 to #5 alongside 28.3% growth, Nuthera’s slide from #16 to #20 implies share is being ceded to faster-rising competitors and that regaining a top-15 position will require reversing multi-quarter rank losses.
Notable Products
Punch Breath Popcorn (7g) posted the largest month-over-month gain at +92.8% and climbed into rank 6, while GMO Cookies Popcorn (7g) fell -22.8% at rank 10, indicating a sharp redistribution within Flower toward value-sized formats. Blue Garlic (3.5g) rose +11.0% at rank 3 and Blue Garlic Popcorn (14g) in rank 9 inched up +1.5%, and with four of the top ten in Flower the category anchors breadth despite mixed momentum; this tilt implies Nuthera is concentrating volume in scalable Flower packs rather than relying on single-serve Pre-Rolls. The mix suggests Nuthera’s commercial direction is to lean into high-velocity Flower variants that can absorb price-sensitive demand while pruning underperforming SKUs.
Top Selling Cannabis Brands
Data for this report comes from real-time sales reporting by participating cannabis retailers via their point-of-sale systems, which are linked up with Headset’s business intelligence software. Headset’s data is very reliable, as it comes digitally direct from our partner retailers. However, the potential does exist for misreporting in the instance of duplicates, incorrectly classified products, inaccurate entry of products into point-of-sale systems, or even simple human error at the point of purchase. Thus, there is a slight margin of error to consider. Brands listed on this page are ranked in the top twenty within the market and product category by total retail sales volume.

