Jun-2026
Sales
Trend
6-Month
Product Count
SKUs
Avg Price
YoY Sales Change
YoY Price Change
Market Insights Snapshot
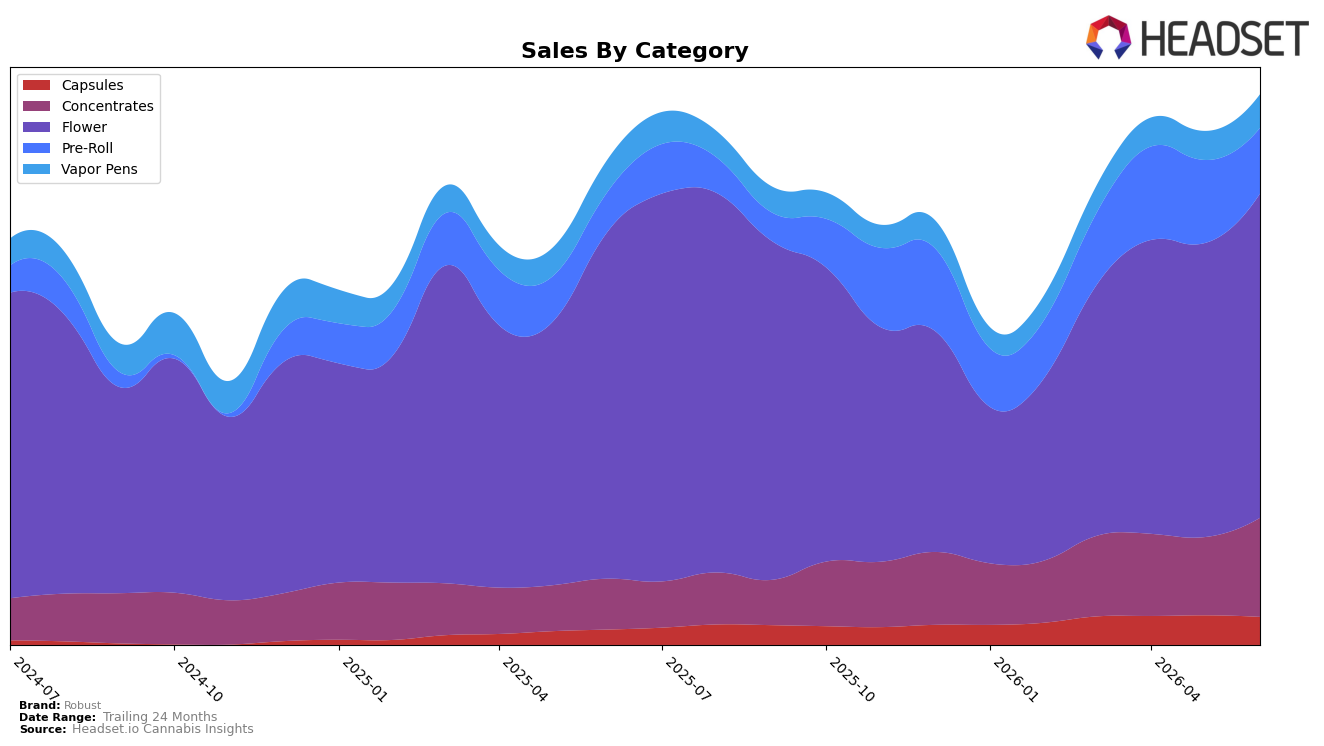
Robust’s mix in June 2026 tilted even further toward Flower at 58.84% share despite a year-over-year decline of 6.79% and a month-over-month increase of 10.28%, while Concentrates expanded to 17.99% share on 94.75% YoY and 26.60% MoM growth. Pre-Roll held 11.92% share with 63.89% YoY growth but fell 21.03% MoM, and Vapor Pens at 6.14% gained 16.02% MoM alongside a 3.80% YoY uptick. Capsules contributed 5.11% share with 81.41% YoY growth but slipped 5.31% MoM, and the brand’s average price fell 13.36% YoY to $23.55 even as total brand sales rose 13.16% YoY. The pattern implies mix-led volume capture: high-growth Concentrates and steady Vapor Pens are offsetting Flower’s YoY softness and Pre-Roll’s MoM pullback, indicating a pivot toward higher-velocity segments while maintaining a Flower-led base.
These shifts suggest a price-to-volume trade that is boosting unit throughput: the 13.36% YoY price decline alongside a 13.16% YoY sales increase indicates unit expansion, and the 26.60% MoM surge in Concentrates against a 21.03% MoM drop in Pre-Roll points to consumers trading into potency and premium formats. With Flower still at 58.84% share but down 6.79% YoY, the 16.02% MoM gain in Vapor Pens and 81.41% YoY rise in Capsules broaden the portfolio’s resilience levers. The implication is that Robust’s positioning is shifting toward a two-engine model—volume stability from Flower plus margin-accretive growth from Concentrates and Vapor Pens—reducing reliance on any single category while supporting sustained share in Missouri where Flower rank sits at 16.
Competitive Landscape
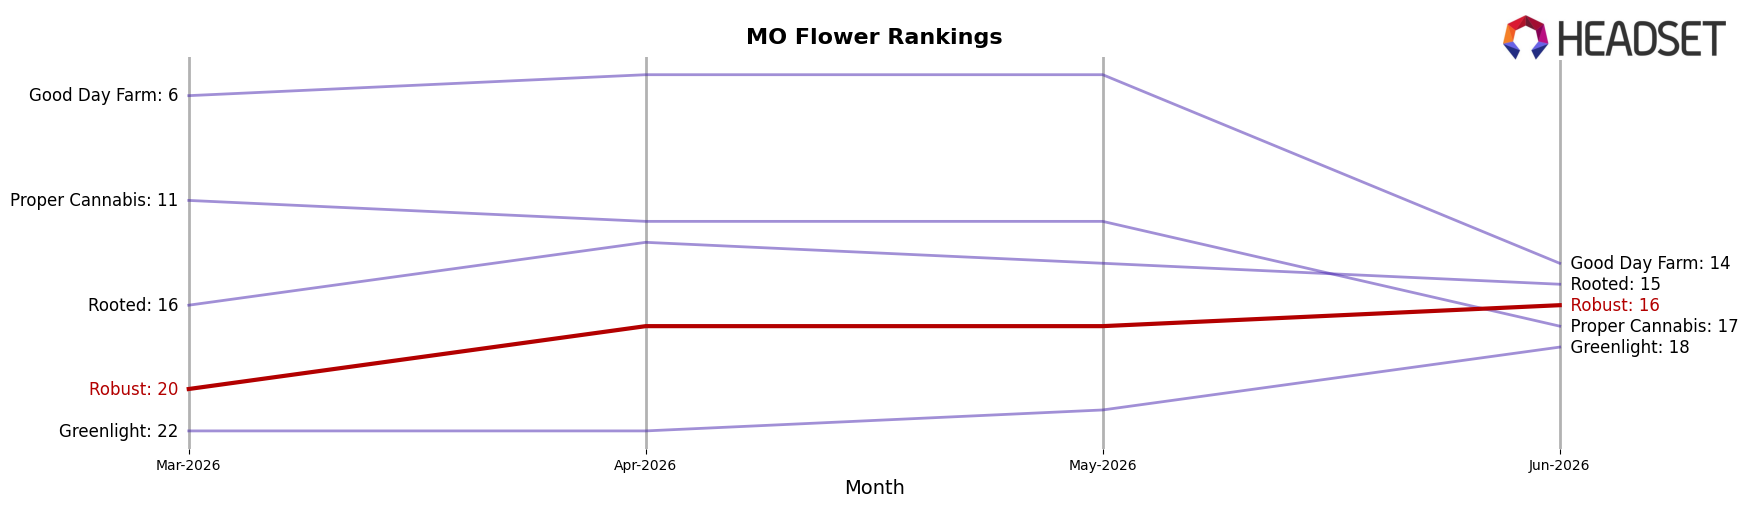
Robust sits at rank #16 in MO Flower in June 2026, slipping 1 position year over year from #15 while improving 4 positions since March 2026 from #20, and it remains 2 spots below its peak of #14 set in September 2025. Competitive dynamics are tightening at the top: Sinse Cannabis climbed from #5 to #2 with a 33.2% year-over-year sales increase, whereas Flora Farms held #1 despite a 5.1% sales decline; this contrast indicates that upward mobility is available even as the leader softens. The combination of a 1-rank YoY dip and a 4-rank quarter-on-quarter recovery implies Robust is stabilizing mid-pack, and the trajectory suggests near-term share gains are plausible only if the post-March climb outpaces top-tier growers’ double-digit growth rates.
Notable Products
Hash Burger (3.5g) posted the steepest move in June 2026 with a -22.6% MoM drop while sliding to rank 9, versus Apples and Bananas #7 (3.5g) up 19.8% at rank 1, indicating share is consolidating into a single flagship at the top. Turbo Terp Pre-Roll 2-Pack (1g) jumped 44.9% MoM to rank 3 while Whipped Cream Pre-Roll 2-Pack (1g) held rank 4 with unspecified change, and two Pre-Roll SKUs now occupy ranks 3–4, pointing to a channel where velocity is catching up to Flower despite lower absolute dollars like $27,668. California Raisins #4 (3.5g) rose 19.1% MoM at rank 8 while three Flower SKUs sit in the top 10 including positions 1 and 9, and this split between a rising flagship and a declining sibling signals assortment pruning pressure within Flower. The mix implies Robust is tilting toward a leader-plus-support model where one premium Flower anchor is paired with accelerating Pre-Rolls, steering assortment toward fewer hero Flowers and more convenience formats for volume.
Top Selling Cannabis Brands
Data for this report comes from real-time sales reporting by participating cannabis retailers via their point-of-sale systems, which are linked up with Headset’s business intelligence software. Headset’s data is very reliable, as it comes digitally direct from our partner retailers. However, the potential does exist for misreporting in the instance of duplicates, incorrectly classified products, inaccurate entry of products into point-of-sale systems, or even simple human error at the point of purchase. Thus, there is a slight margin of error to consider. Brands listed on this page are ranked in the top twenty within the market and product category by total retail sales volume.

