Jun-2026
Sales
Trend
6-Month
Product Count
SKUs
Avg Price
YoY Sales Change
YoY Price Change
Market Insights Snapshot
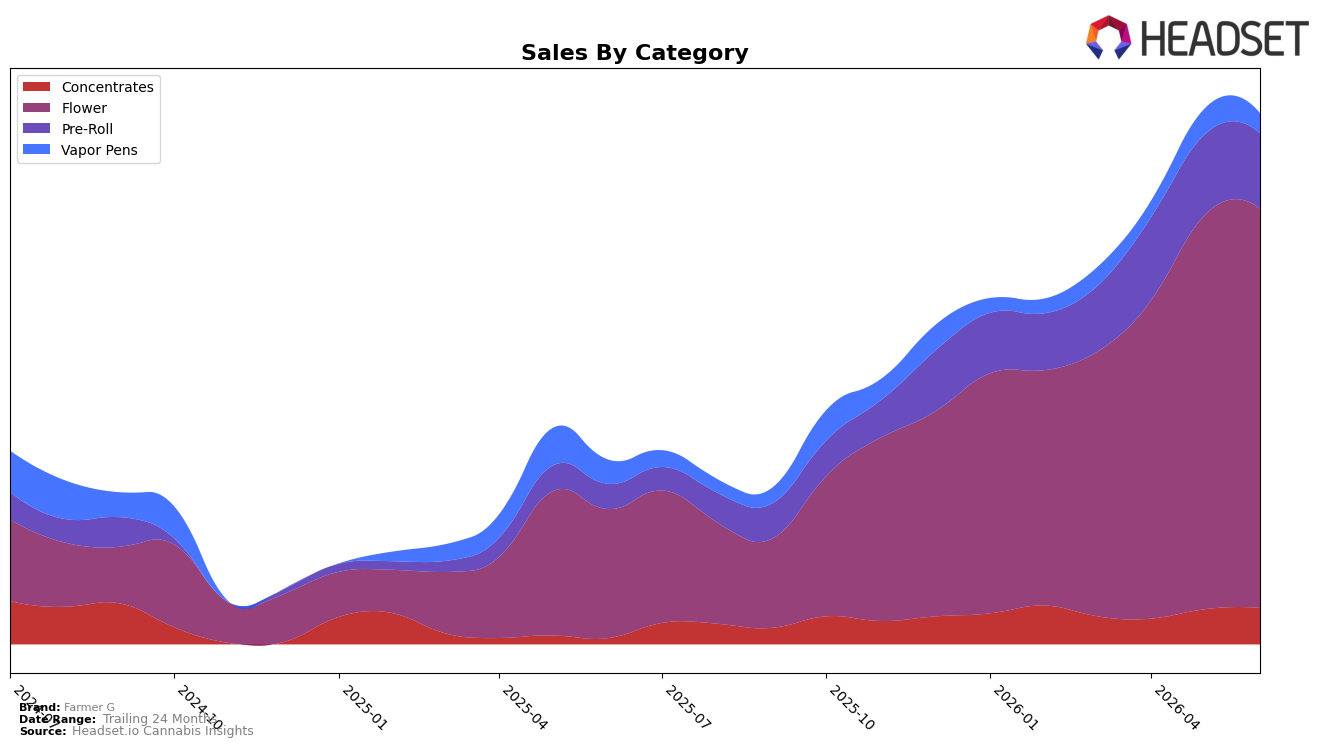
In June 2026, Farmer G’s mix is concentrated in Flower at 75.22% share with 209.69% year-over-year growth and a 1.26% month-over-month uptick, while Pre-Roll holds 14.21% share with 203.01% year-over-year growth but a 6.29% month-over-month decline; Concentrates contribute 6.83% share with 510.22% year-over-year growth and a 3.96% month-over-month increase, and Vapor Pens sit at 3.75% share with a 16.87% year-over-year decline and a 22.96% month-over-month drop. The brand’s average price rose 54.51% year over year to $25.08, while Flower’s category-average price within the brand sits at $34.90, indicating mix-up effects alongside premiumization; in this context, Farmer G’s top state Missouri and top category Flower align with a Flower rank of 8 in that state, implying that June 2026 momentum is anchored in high-growth Flower and Concentrates despite a pullback in Vapor Pens.
The combination of a 209.69% year-over-year surge in Flower alongside a 510.22% increase in Concentrates, paired with Vapor Pens’ 16.87% year-over-year contraction and 22.96% month-over-month decline, implies an intentional emphasis on inhalable formats skewing toward Flower and dabbable potency rather than hardware-dependent options. With overall brand sales up 189.00% year over year and the brand’s 1.26% month-over-month Flower gain counterbalancing a 6.29% Pre-Roll dip, the category balance suggests Farmer G is positioned to climb from rank 8 in Flower in Missouri by leaning into higher-price Flower ($34.90) and reinforcing Concentrates growth, while de-prioritizing Vapor Pens to avoid margin drag.
Competitive Landscape
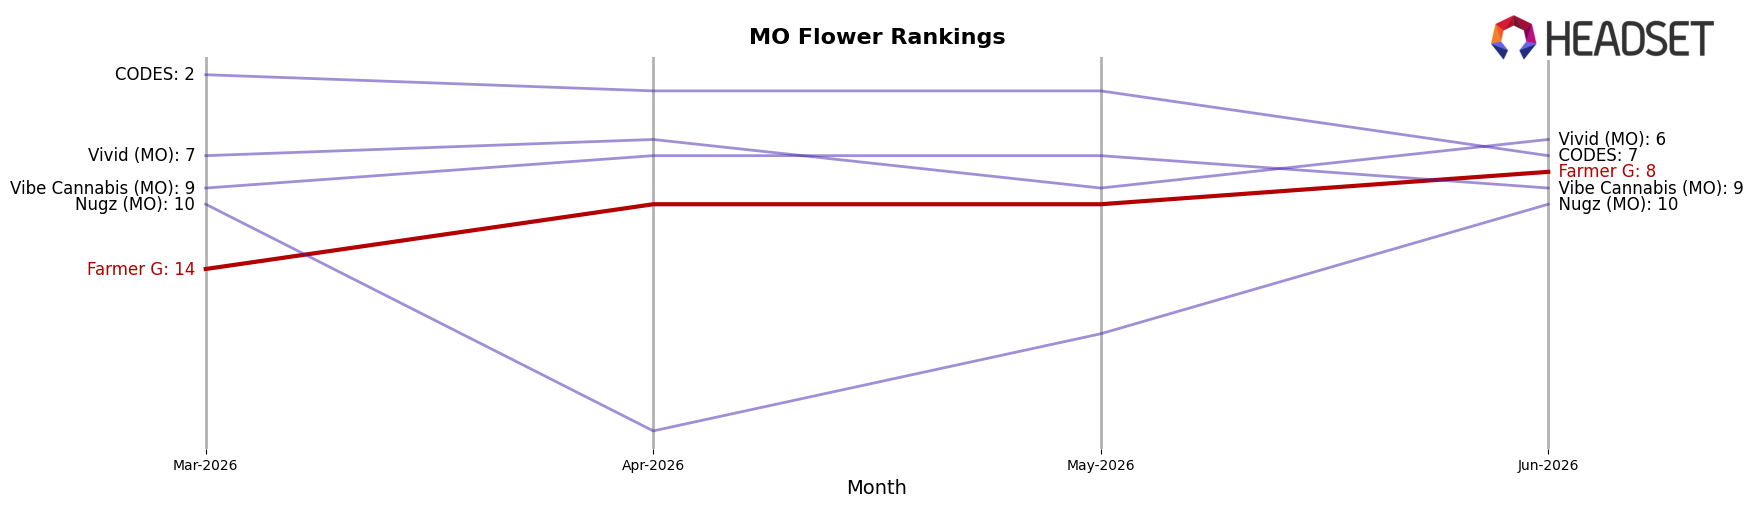
Farmer G sits at rank #8 in MO Flower in June 2026, improving 18 positions year over year from #26 to #8 and rising 6 spots from #14 three months ago; this marks a peak rank of #8 in June 2026 while peers show mixed momentum, as Flora Farms held #1 with a year-over-year decline of 5.1% and Sinse Cannabis advanced from #5 to #2 with 33.2% sales growth. With Amaze Cannabis moving from #6 to #4 and Local Cannabis Co. climbing from #10 to #5, Farmer G’s ascent to #8 amid faster-rising competitors indicates share is being won through mid-tier displacement rather than top-tier erosion, implying continued gains will require maintaining the current rank velocity against brands accelerating into the top five.
Notable Products
Gello (3.5g) posted the steepest movement in June 2026 with a -53.2% month-over-month drop while falling to rank 9, and Champagne Patties Pre-Roll (0.5g) declined even further at -56.6% MoM at rank 10. In contrast, Tropicana Cherry (3.5g) rose +29.0% MoM to rank 6, and Coal Creek Kush Pre-Roll (0.5g) gained +25.5% MoM at rank 5, pointing to mixed velocity within the top 10. Six of the top ten are Pre-Roll SKUs, concentrated at ranks 1–5 and 8–10, which indicates assortment weight and shopper engagement skew toward smaller ticket trial formats over larger flower packs. The pattern implies Farmer G’s near-term commercial direction is anchored in pre-roll-led traffic while flower volatility requires tighter SKU curation to stabilize category contribution.
Top Selling Cannabis Brands
Data for this report comes from real-time sales reporting by participating cannabis retailers via their point-of-sale systems, which are linked up with Headset’s business intelligence software. Headset’s data is very reliable, as it comes digitally direct from our partner retailers. However, the potential does exist for misreporting in the instance of duplicates, incorrectly classified products, inaccurate entry of products into point-of-sale systems, or even simple human error at the point of purchase. Thus, there is a slight margin of error to consider. Brands listed on this page are ranked in the top twenty within the market and product category by total retail sales volume.

