.svg)


Where to Buy
OHHO is stocked at 34 licensed dispensaries across New York, with the deepest coverage in New York, Brooklyn, Queens, Syracuse, and Buffalo. Search by ZIP code or city below to find the closest one, or filter by product type if you are after a specific format.
Market Insights Snapshot
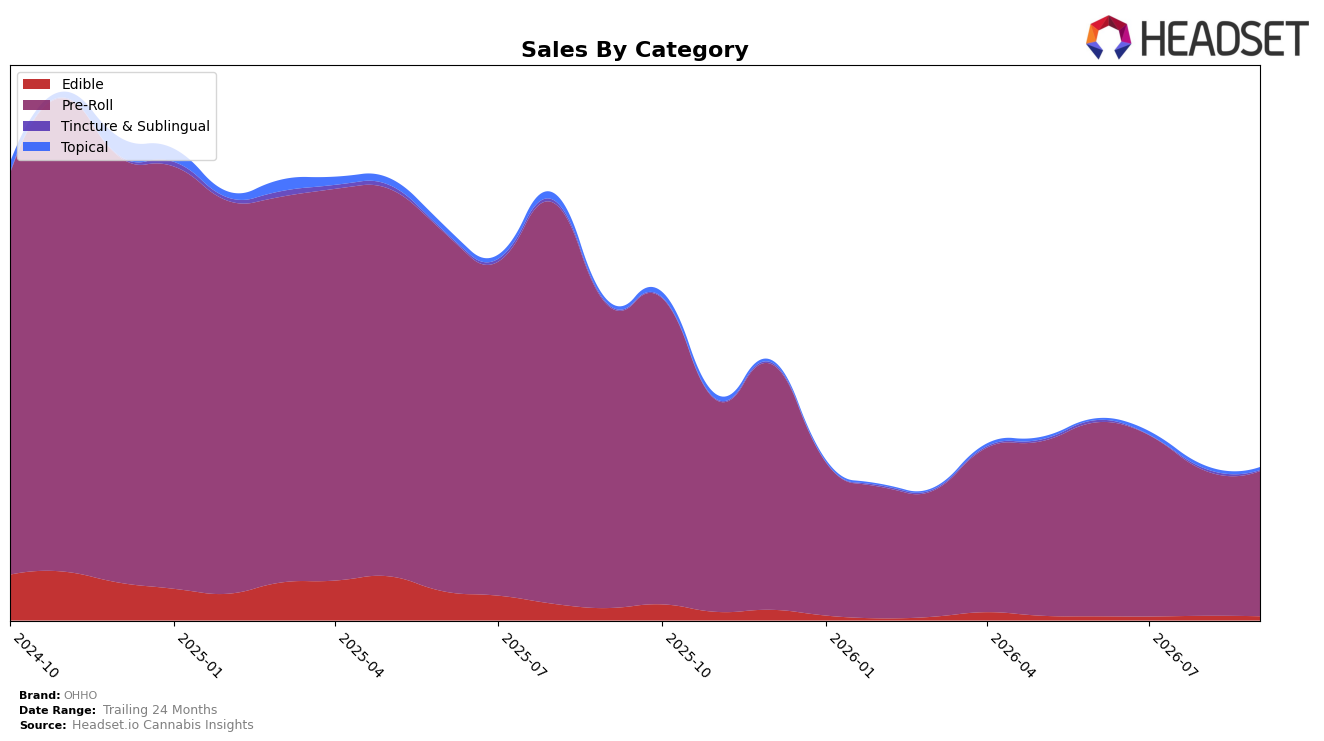
In September 2026, OHHO concentrated 95.41% of sales in Pre-Roll, where year-over-year declined 52.05% and month-over-month slipped 0.08%, while Edible held 2.54% share with a 68.12% YoY drop and a 10.51% MoM decline. Topical accounted for 1.70% share with an 11.48% YoY reduction and a 4.80% MoM dip, and Tincture & Sublingual at 0.36% share contracted 41.60% YoY and 65.61% MoM; average price rose 2.98% YoY to $15.95. With brand sales down 52.26% YoY and a 24‑month change of −62.67%, the sales base is narrowing toward Pre-Roll, implying OHHO is overexposed to a single-category cycle and under-indexing in diversification.
The marginal MoM erosion in Pre-Roll at 0.08% versus a 10.51% MoM decline in Edible signals that near-term volume stability is anchored in Pre-Roll, yet the 52.05% YoY contraction there, paired with a 41.60% YoY fall and 65.61% MoM drop in Tincture & Sublingual, indicates limited insulation against demand shocks. With Topical down only 11.48% YoY but just 1.70% share, the brand lacks meaningful scale in less-volatile formats, and the slight 2.98% YoY price increase alongside a 52.26% YoY sales decline suggests mix-driven volume loss; together this pattern implies OHHO’s positioning is price-holding but volume-levered to a single format, making expansion in smaller, steadier categories a prerequisite for reducing category-concentration risk in New York.
Competitive Landscape
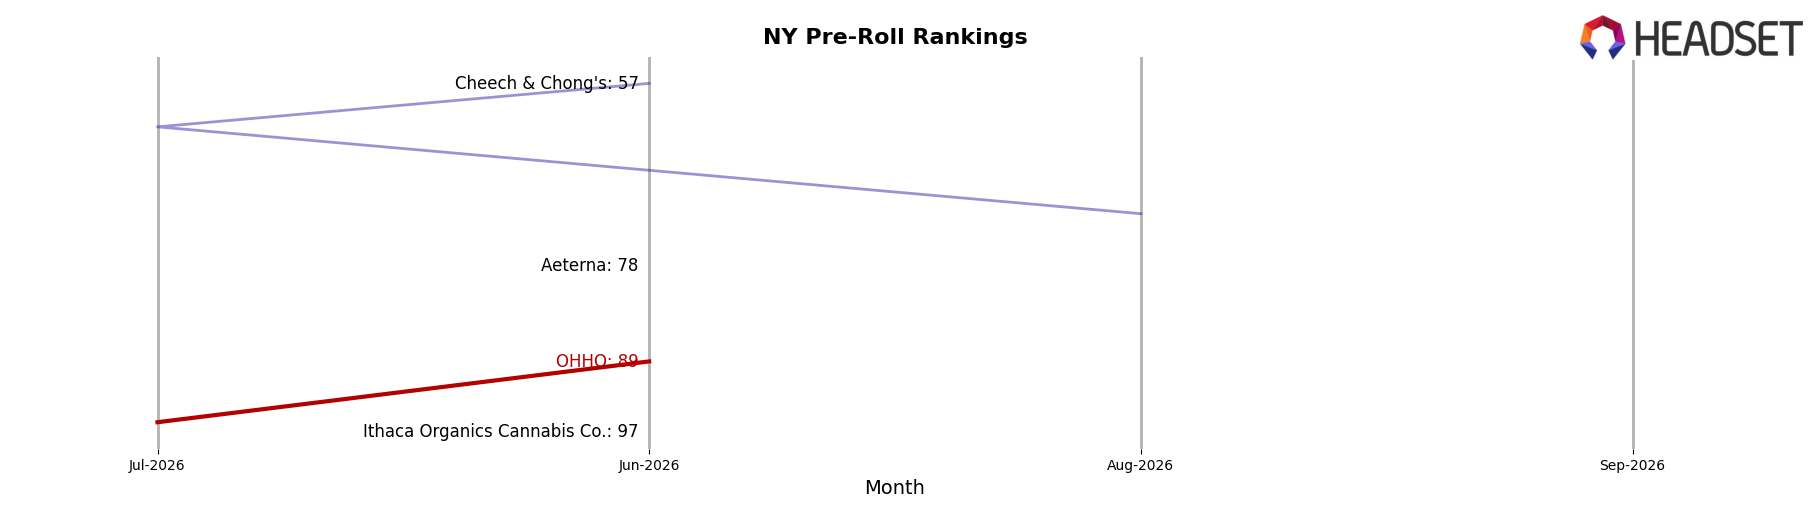
OHHO sits at rank 110 in NY Pre-Roll in September 2026, sliding 50 positions year over year from rank 60 and dropping 21 spots since June 2026 from rank 89, while its historical peak of rank 35 in February 2025 underscores a longer downtrend; meanwhile, Ruby Farms held rank 1 with a year-over-year rank change of 0 as Jeeter climbed from rank 6 to rank 2 with 122.5% sales growth, indicating that OHHO’s relative decline is occurring alongside upward mobility among leading peers, which implies the brand’s rank trajectory points to share erosion in a consolidating top tier.
Notable Products
OG Kush Pre-Roll (0.5g) posted the steepest decline at -53.9% and slid to rank 4, while Durban Poison Pre-Roll 7-Pack (3.5g) fell -34.5% at rank 8, indicating volatility concentrated in value-oriented formats. In contrast, Jack Herer Pre-Roll (0.5g) climbed +26.2% to rank 3 and Super Lemon Haze Pre-Roll (0.5g) grew +20.2% to hold rank 1, even as Good Time Dots Watermelon and Mint Gummies 10-Pack (100mg) surged +48.6% at rank 9 off a smaller base. With eight of the top ten coming from the Pre-Roll category and only one Edible and one Topical present, the assortment is concentrated around single-stick and multi-pack inhalables.
Super Lemon Haze Pre-Roll 7-Pack (3.5g) added +7.8% at rank 5 and OG Kush Pre-Roll 7-Pack (3.5g) added +6.4% at rank 6, while Jack Herer Pre-Roll 7-Pack (3.5g) dipped -1.9% at rank 7, pointing to pack-size stability despite the single-stick swings. Super Lemon Haze Pre-Roll (0.5g) reached $9,204 with +20.2% MoM while Durban Poison Pre-Roll (0.5g) rose +12.1% at rank 2, suggesting flavor-led singles are pulling shoppers back even as OG Kush variants bifurcate between a -53.9% single-stick drop and a +6.4% 7-pack uptick. The overall pattern implies OHHO is tilting toward flavor-forward single-sticks for traffic and leaning on 7-packs for retention and basket size, with limited traction yet from non-inhalable extensions.
Top Selling Cannabis Brands






Data for this report comes from real-time sales reporting by participating cannabis retailers via their point-of-sale systems, which are linked up with Headset’s business intelligence software. Headset’s data is very reliable, as it comes digitally direct from our partner retailers. However, the potential does exist for misreporting in the instance of duplicates, incorrectly classified products, inaccurate entry of products into point-of-sale systems, or even simple human error at the point of purchase. Thus, there is a slight margin of error to consider. Brands listed on this page are ranked in the top twenty within the market and product category by total retail sales volume.

