.svg)

Sep-2026
Sales
Trend
6-Month
Product Count
SKUs
Avg Price
YoY Sales Change
YoY Price Change


Where to Buy
Old School Hash Co. is stocked at 258 licensed dispensaries across Michigan, with the deepest coverage in New Buffalo, Detroit, Grand Rapids, Monroe, and Kalamazoo. Search by ZIP code or city below to find the closest one.
Market Insights Snapshot
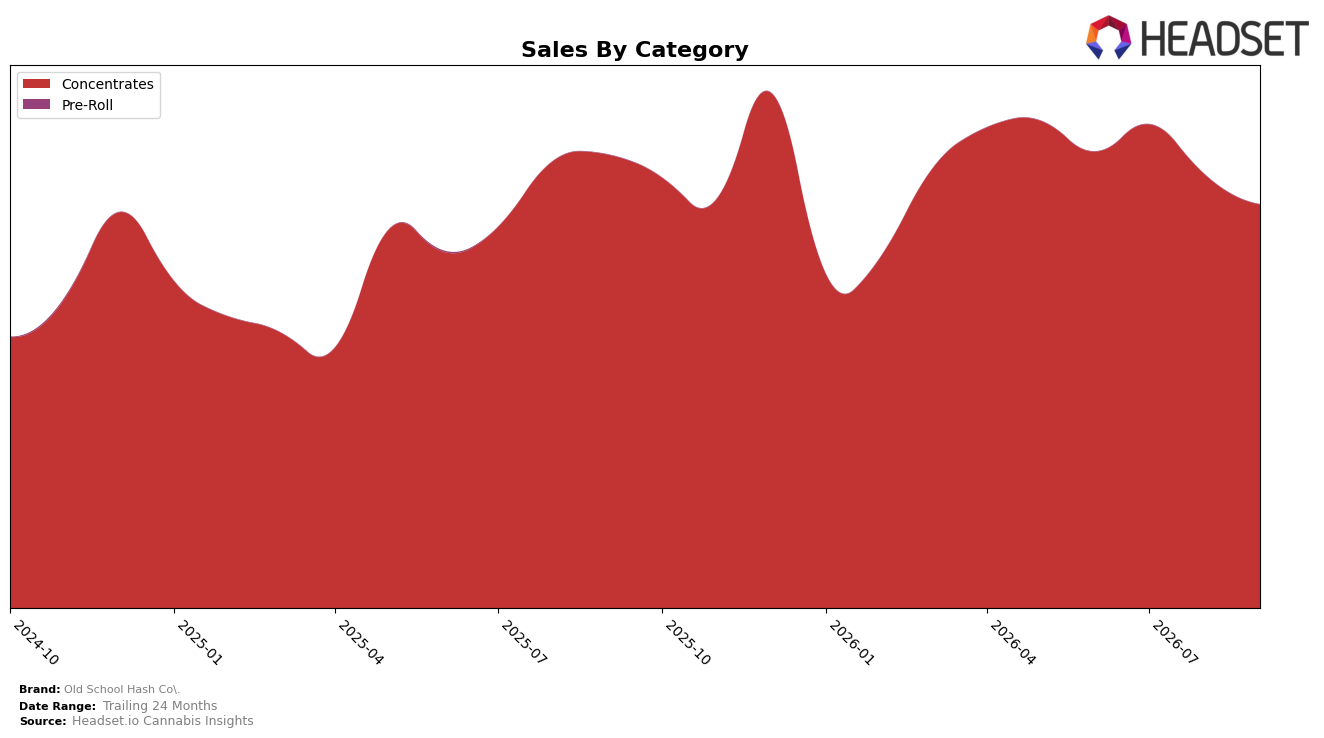
Old School Hash Co. concentrated entirely in Concentrates during September 2026, with category share at 100.0% and a rank of 7 in Michigan Concentrates, while sales declined 10.99% year over year and 6.95% month over month. Average price rose 19.88% year over year alongside a single-category focus, implying mix-driven exposure where any weakness in Concentrates flows directly into total performance without diversification offsets.
The combination of a 19.88% price increase and a 10.99% sales decline, paired with a month-over-month drop of 6.95% against a rank of 7, implies that Old School Hash Co. is leaning on price to sustain value-per-unit in a tightening demand pocket. With 100.0% of sales in Concentrates and Michigan as the top market context, the positioning skews toward deeper share defense within a single category rather than cross-category capture, suggesting that near-term stability depends on improving conversion within Concentrates or easing price to recover volume.
Competitive Landscape
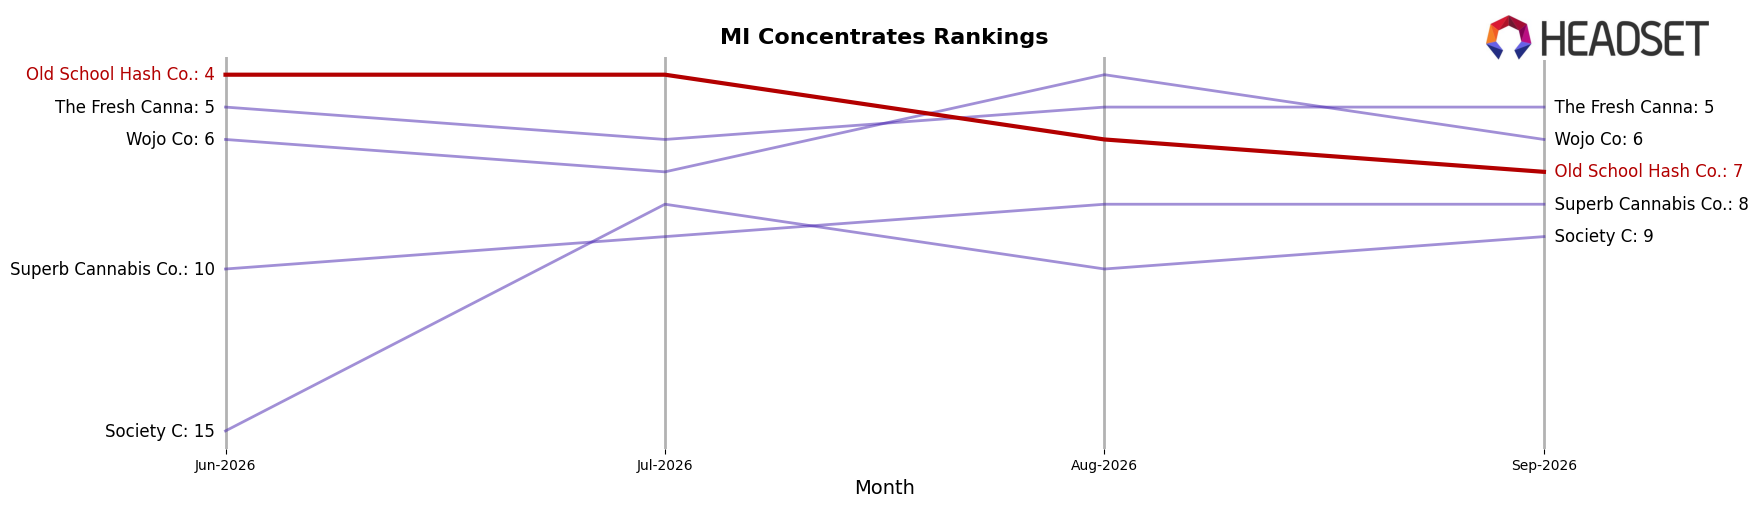
Old School Hash Co. sits at rank #7 in MI Concentrates in September 2026, down 1 position year over year from #6, after sliding 3 spots from its July 2026 peak at #4 to #7 by September 2026; meanwhile, Rkive Cannabis advanced from #3 to #1 with 130.9% YoY sales growth, and Uniq Pressure vaulted from #96 to #3 alongside a 2,216.9% YoY sales surge. Compared with Cannalicious Labs, which moved from #2 to #4 amid a 38.5% YoY decline, Old School Hash Co.’s drop from #4 in July 2026 to #7 in September 2026 indicates share was ceded to faster-ascending players, implying the brand must re-accelerate mix or distribution to avoid further rank erosion as the top three consolidate gains.
Notable Products
Super Boof Bubble Hash (1g) delivered the largest movement in September 2026 with a +95.4% month-over-month jump to rank 1, while Blue Dream Brick Hash (1g) followed with an +83.4% surge at rank 2. In contrast, Bubba Kush Bubble Hash (1g) fell -35.1% yet still held rank 4, and Runtz Brick Hash (1g) declined -15.1% at rank 8. With all top-10 entries in Concentrates and two Super Boof SKUs present, the mix signals a pivot toward a few fast-scaling hash-led winners anchoring share at the top of the lineup.
Top Selling Cannabis Brands






Data for this report comes from real-time sales reporting by participating cannabis retailers via their point-of-sale systems, which are linked up with Headset’s business intelligence software. Headset’s data is very reliable, as it comes digitally direct from our partner retailers. However, the potential does exist for misreporting in the instance of duplicates, incorrectly classified products, inaccurate entry of products into point-of-sale systems, or even simple human error at the point of purchase. Thus, there is a slight margin of error to consider. Brands listed on this page are ranked in the top twenty within the market and product category by total retail sales volume.

