Market Insights Snapshot
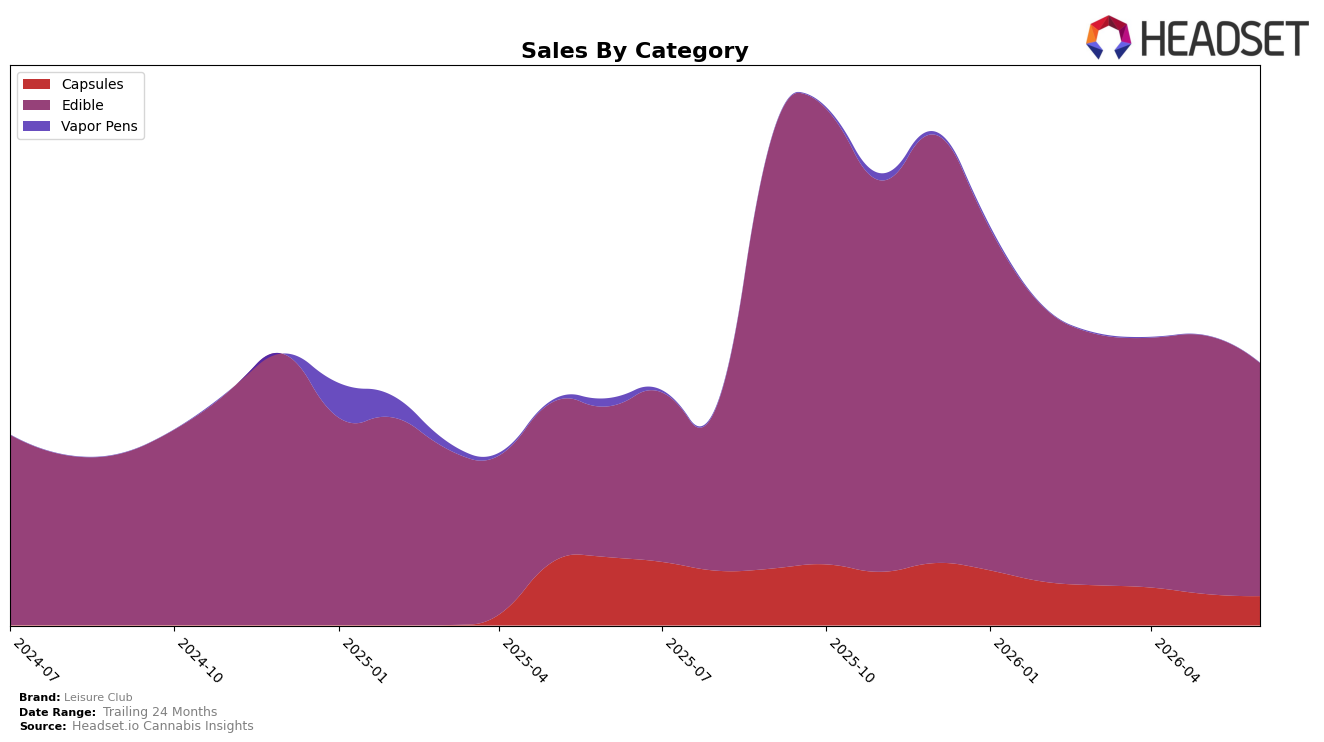
In June 2026, Leisure Club concentrated 88.91% share in Edible while Capsules accounted for 11.09%, a mix that tilted further toward Edible as Edible grew 54.70% year over year but fell 9.85% month over month, whereas Capsules declined 57.30% year over year and 7.02% month over month. Despite total brand sales rising 15.70% year over year, the average price jumped 125.13%, and Edible’s average price reached one allowed dollar figure of $21.24, indicating unit volumes likely shifted unevenly across formats; the pattern suggests Leisure Club is trading up within Edible even as near-term monthly softness tempers that momentum.
With Edible at rank 10 in Alberta and holding 88.91% of mix alongside a 54.70% year-over-year lift, the brand’s positioning is skewed toward scale in a single category while exposure to a 9.85% month-over-month dip raises short‑cycle volatility risk. The 57.30% year-over-year decline in Capsules combined with an 11.09% share signals deprioritization rather than a temporary pullback, and the 125.13% average price increase relative to a 15.70% sales gain implies a premiumization strategy that could sustain share in Edible but leave gaps in value tiers where month-over-month softness can quickly erode placement.
Competitive Landscape
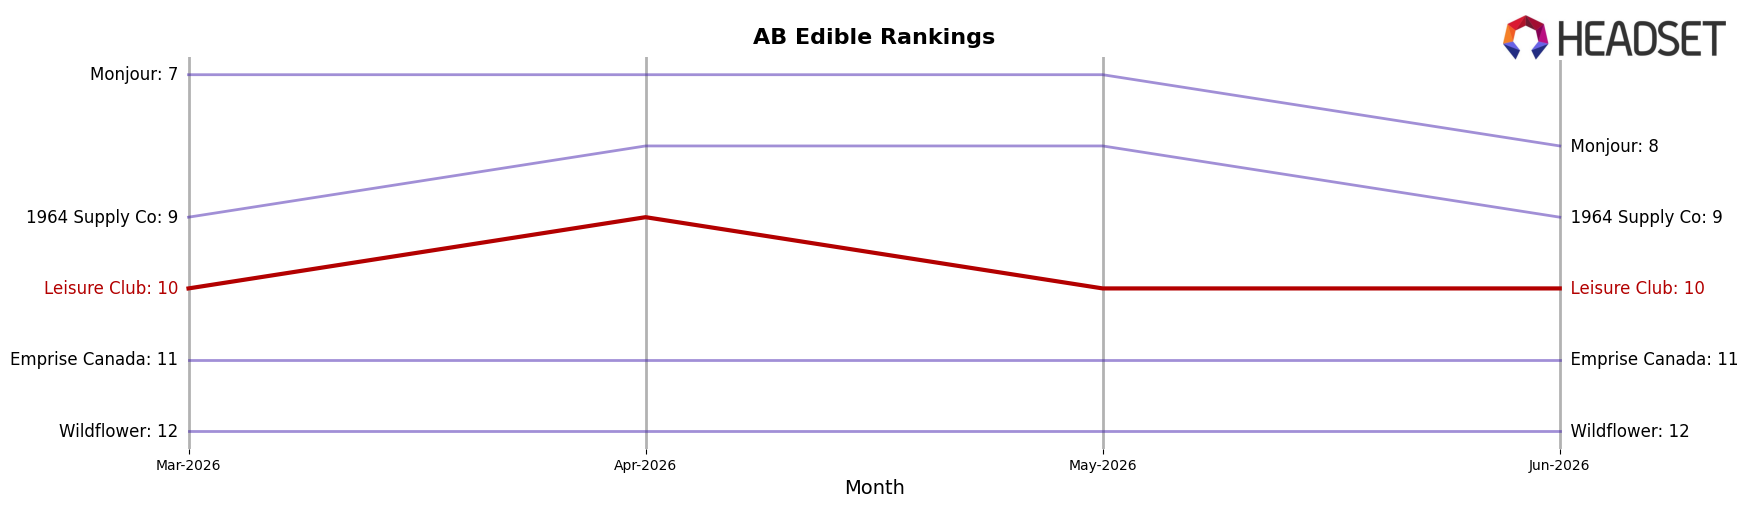
Leisure Club sits at #10 in AB Edible in June 2026, a 1-position improvement from #11 year over year and unchanged from #10 three months ago; the brand’s peak of #6 in September 2025 contrasts with the current #10, indicating a 4-place slide from its high. Among competitors, Olli advanced from #5 to #3 year over year while growing sales by 57.9%, and Gron / Grön moved down from #3 to #5 despite a 0.0% sales change, whereas Spinach held #1 with 9.6% growth; this mix of upward and flat-to-declining rank shifts around Leisure Club implies the brand’s incremental rank gain is more defensive than expansionary and that reclaiming share will require outperforming faster movers clustered in the #3–#5 band.
Notable Products
Cherry Fizz Live Rosin Gummies 5-Pack (10mg) led the month’s movement with a -18.7% MoM slide while still holding rank 1, and CBG/CBD/THC 1:1:1 Tangerine Splash Live Rosin Gummies 10-Pack (10mg CBG, 10mg CBD, 10mg THC) followed at rank 2 with a -10.0% MoM change; the combined pattern at the very top implies demand is concentrating in flagship SKUs even as velocity cools. Four of the top ten are Edible SKUs, yet the mix shows divergence as Tropical Berry Live Rosin Gummies 5-Pack (10mg) jumped +47.2% MoM at rank 6 while Sour Apple Live Rosin Gummies 5-Pack (10mg) fell -36.3% at rank 8, indicating flavor-driven substitution within the same format. Capsules split directions with Pineapple Express Capsule 5-Pack (50mg) up +1.7% at rank 4 and Pink Kush Capsule 5-Pack (50mg) down -16.7% at rank 5, suggesting strain-specific preference is shaping share more than the dosage format; the $57,859 in June 2026 sales for Tangerine Splash underscores how volume is anchored in multi-cannabinoid gummies despite mixed momentum. Overall, the product mix points to Leisure Club leaning into multi-cannabinoid and flavor-led Edibles for commercial direction while rationalizing underperforming flavors rather than shifting away from the format.
Top Selling Cannabis Brands
Data for this report comes from real-time sales reporting by participating cannabis retailers via their point-of-sale systems, which are linked up with Headset’s business intelligence software. Headset’s data is very reliable, as it comes digitally direct from our partner retailers. However, the potential does exist for misreporting in the instance of duplicates, incorrectly classified products, inaccurate entry of products into point-of-sale systems, or even simple human error at the point of purchase. Thus, there is a slight margin of error to consider. Brands listed on this page are ranked in the top twenty within the market and product category by total retail sales volume.

