Jun-2026
Sales
Trend
6-Month
Product Count
SKUs
Avg Price
YoY Sales Change
YoY Price Change
Market Insights Snapshot
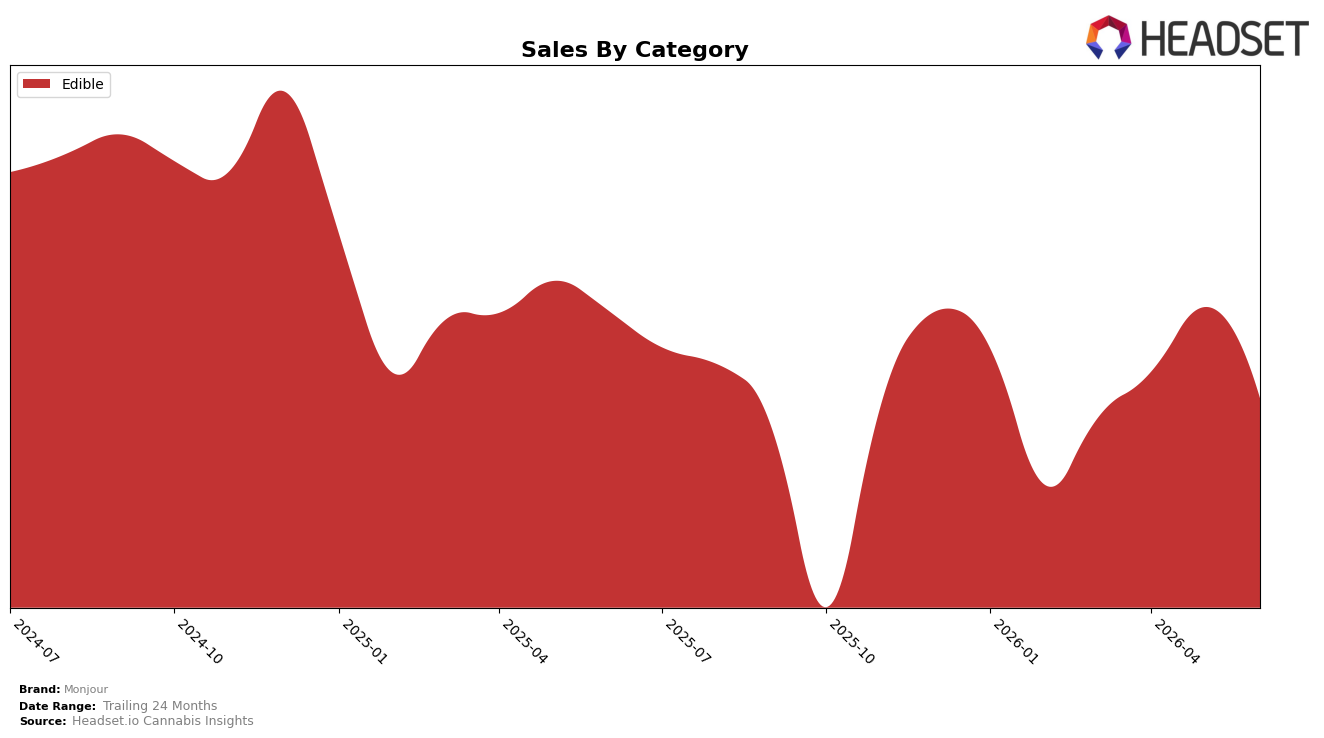
In June 2026, Monjour’s mix remained concentrated with Edible at 100.0% share, while Edible sales were down 8.0% year over year and down 8.3% month over month, indicating simultaneous contraction on both timelines. Average price rose 10.8% year over year alongside a 100.0% category concentration, a pairing that implies price-led contribution could not offset volume softness; the net inference is that a single-category posture amplified exposure to an 8.0% YoY decline and an 8.3% MoM dip.
Positionally, a rank of 7 in Edible within British Columbia combined with a 10.8% YoY price increase and an 8.0% YoY sales decline argues for a value–mix mismatch in the current lane. With 100.0% of sales in Edible and a 17.0% two-year decline against a June 2026 MoM drop of 8.3%, the pattern implies that Monjour’s pricing and pack architecture are narrowing addressable demand, and that incremental share gains will require either price realignment or subcategory diversification within Edibles rather than leaning further on the existing assortment.
Competitive Landscape
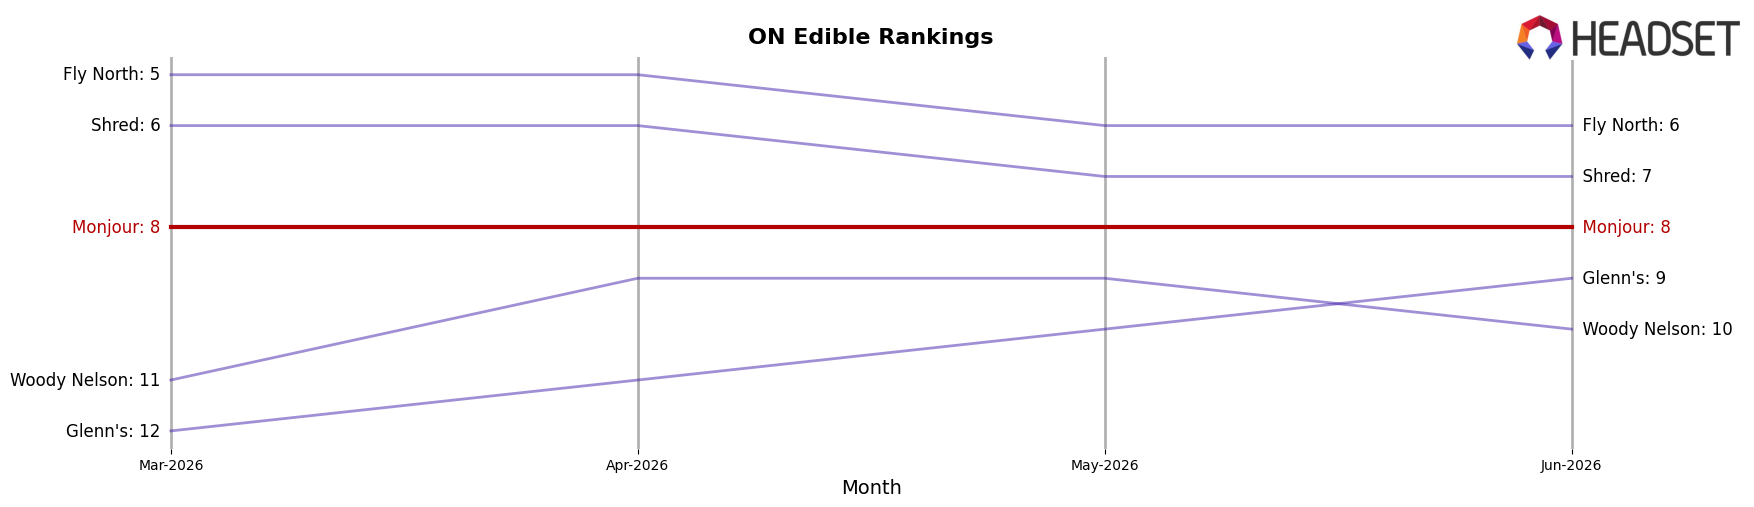
Monjour sits at rank #8 in ON Edible in June 2026, slipping 2 positions year over year from #6 while holding flat versus March 2026 at #8, and this contrasts with Olli advancing from #7 to #4 alongside a 120.7% YoY sales increase and Wyld improving from #4 to #3 with a 21.9% YoY lift. The category’s top tier remained steady as Spinach maintained #1 with 9.9% YoY growth while Gron / Grön held #2 with 6.4% YoY growth, whereas Monjour’s best historical position was #5 in January 2025 and its three-month rank did not improve from #8. The pattern implies Monjour’s rank trajectory is stagnating as faster-growing peers consolidate higher positions, signaling that without a relative growth step-change the brand risks drifting from prior peak #5 toward the lower half of the top 10.
Notable Products
CBD Berry Good Day Gummies 5-Pack (100mg CBD) posted the steepest decline at -64.1% MoM and fell to rank 8, while the CBD Orchard Medley Gummies 5-Pack (150mg CBD) dropped -55.8% MoM at rank 9, indicating sharp pressure on trial-size formats even as the category remains concentrated in Edibles. At the top, CBN:CBD:THC 8:3:1 Bedtime Blueberry Lemon Gummies 4-Pack (80mg CBD, 30mg CBN, 10mg THC) held rank 1 despite a -9.5% MoM dip, and CBD/CBN/CBG 20:5:5 Twilight Tranquility Sugar-Free Gummies 25-Pack (500mg CBD, 125mg CBN, 125mg CBG) stayed at rank 3 with a -9.7% MoM slide, suggesting large-format wellness blends are stabilizing anchor SKUs. Four of the top ten are Bedtime or Twilight-branded formulations featuring CBN or multi-cannabinoid blends, while entry packs contracted, pointing to a mix shifting toward higher-commitment relaxation use-cases over casual sampling.
Top Selling Cannabis Brands
Data for this report comes from real-time sales reporting by participating cannabis retailers via their point-of-sale systems, which are linked up with Headset’s business intelligence software. Headset’s data is very reliable, as it comes digitally direct from our partner retailers. However, the potential does exist for misreporting in the instance of duplicates, incorrectly classified products, inaccurate entry of products into point-of-sale systems, or even simple human error at the point of purchase. Thus, there is a slight margin of error to consider. Brands listed on this page are ranked in the top twenty within the market and product category by total retail sales volume.

